


The power of Dashboards to show insights across different data points comes from integrating filters across dashlets. You can start with a high overview of what’s happening across your LMS and then with a couple of clicks see a much more specific picture, such as who has completed a specific course in the past month.
In our last How To Zoola post, we showed you how to link dashlets in a dashboard using parameter mapping. This month, we’ll take that one step further to show you how to use your charts to filter other dashlets.
Here, I’m using a common request to show number of enrolments by course within a certain course category, with the ability to drill down to see completion rates by course.
For this example, I’ve built a dashboard with two reports:
- A bar chart showing number of enrolments by course
- A table report showing completion status by user and course
Once you’ve added your dashlets to the dashboard designer, try the following:
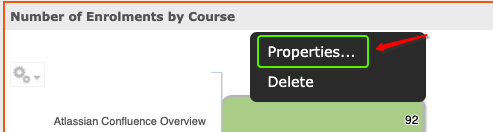
- Right click on your chart dashlet and select “Properties…”
- Select the Hyperlinks tab and then check the Enable chart hyperlinks box:
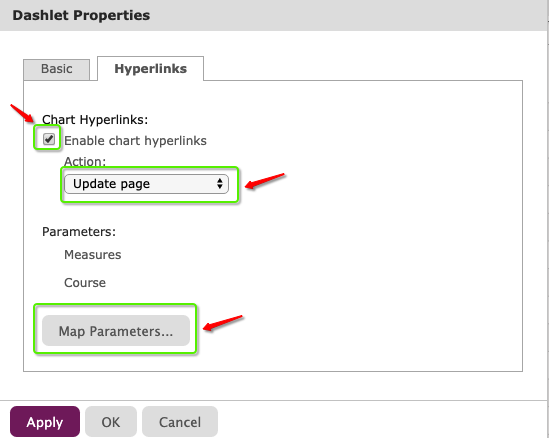
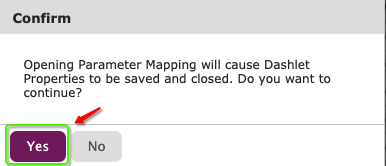
Keep the “Update page” option in the dropdown, then click “Map Parameters”. - Click “Yes” on the confirmation popup:
- Use the Parameter Mapping popup to map your chart (Number of Enrolments by Course) as the Source Dashlet that will control the Dashlet affected, Course Completions by the Course filter.
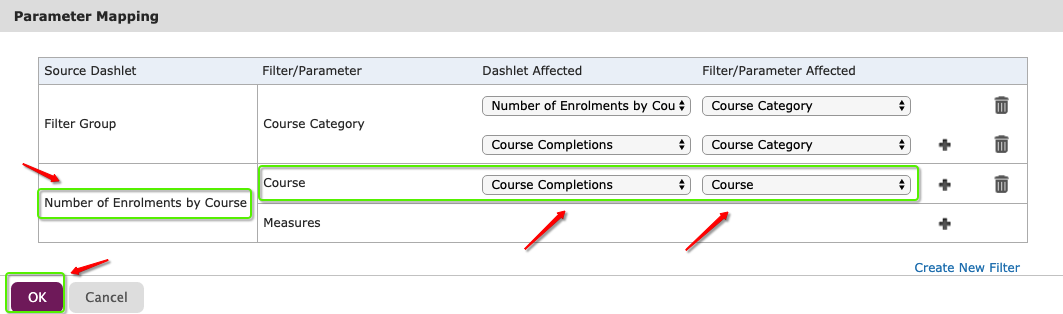
- Click OK
You can see that I’ve set up this dashboard to first look at the results by Course Category, then to drill down to the Course level using the chart. Here, I’ve used the chart to select the Company Orientation course. 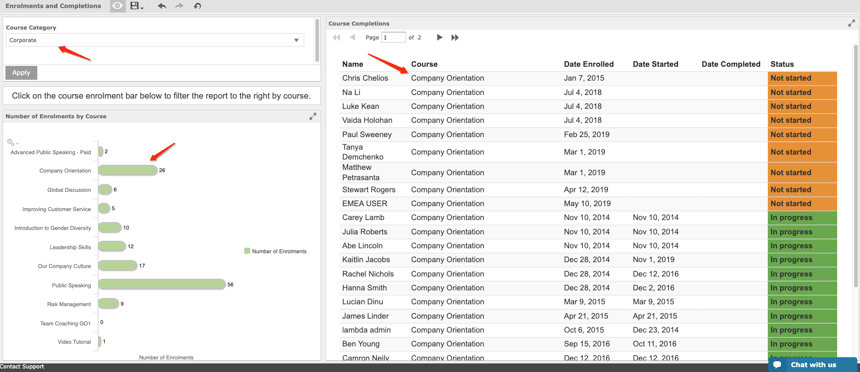
Finally, I used Conditional Formatting on the table report to highlight the completion status.
Click on the following links for more information on using filters in Zoola Analytics:
