PAINTING BY NUMBERS
A lifetime ago I graduated as an environmental biologist.
I was one of those kids who did well in school, but had no idea what his vocation was. As a pimply teenager with minimal life experience, how was I to know even half the jobs that existed?
After much dilly dallying, I eventually drew upon my nerdy interest in science and my idealistic zeal for conservation and applied for a BSc. And while I eventually left the science industry, I consider myself extremely fortunate to have studied the discipline because it has been the backbone of my career.
Science taught me to think about the world in a logical, systematic manner. It’s a way of thinking that is founded on statistics, and I maintain it should inform the activities we undertake in other sectors of society such as Learning & Development.
The lectures I attended and the exams I crammed for faded into a distant memory, until the emergence of learning analytics rekindled the fire.
Successive realisations have rapidly dawned on me that I love maths and stats, I’ve floated away from them over time, the world is finally waking up to the importance of scientific method, and it is high time I refocused my attention onto it.
So it is in this context that I have started to review the principles of statistics and its contemporary manifestation, analytics. My exploration has been accompanied by several niggling queries: what’s the difference between statistics and analytics? Is the latter just a fancy name for the former? If not, how not?
Overlaying the post-modern notion of data science, what are the differences among the three? Is a data scientist, as Sean Owen jokingly attests, a statistician who lives in San Francisco?THE DIKW PYRAMID
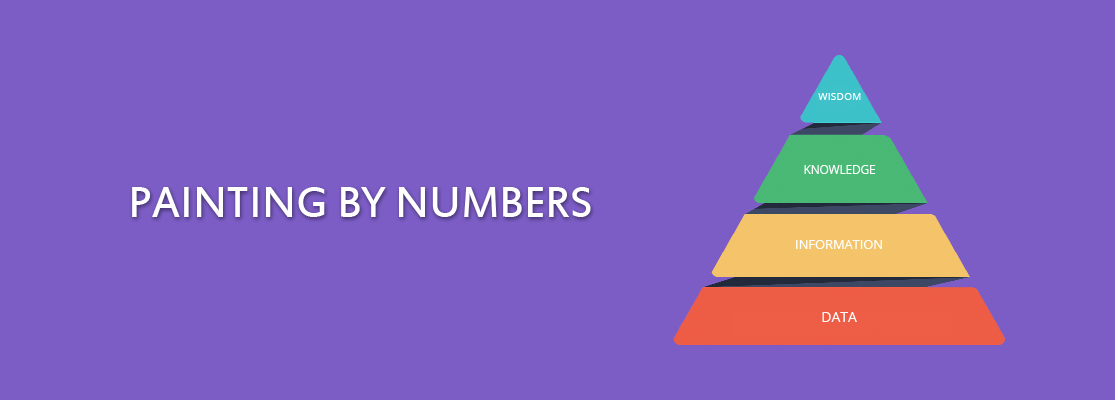
My journey of re-discovery started with the DIKW Pyramid. This beguilingly simple triangle models successive orders of epistemology, which is quite a complex concept. Here’s my take on it…At the base of the pyramid, DATA is a set of values of qualitative or quantitative variables. In other words, it is the collection of facts or numbers at your disposal that somehow represent your subject of study. For example, your data may be the weights of 10,000 people. While this data may be important, if you were to flick through the reams of numbers you wouldn’t glean much from them.
The next step up in the pyramid is INFORMATION. This refers to data that has been processed to make it intelligible. For example, if you were to calculate the average of those ten thousand weights, you’d have a comprehensible number that is inherently meaningful. Now you can do something useful with it.
The next step up in the pyramid is KNOWLEDGE. To avoid getting lost in a philosophical labyrinth, I’ll just say that knowledge represents understanding. For example, if you were to compare the average weight against a medical standard, you might determine these people are overweight.
The highest step in the pyramid is WISDOM. I’ll offer an example of wisdom later in my deliberation, but suffice it to say here that wisdom represents higher order thinking that synthesises various knowledge to generate insight. For example, the wise man or woman will not only know these people are overweight, but also recognise they are at risk of disease.
Some folks describe wisdom as future focused, and I like that because I see it being used to inform decisions.STATISTICS
My shorthand definition of statistics is the analysis of numerical data.
In practice, this is done to describe a population or to compare populations – that is to say, infer significant differences between them.
For example, by calculating the average weight of 10,000 people in Town A, we describe the population of that town. And if we were to compare the weights of those 10,000 people with the weights of 10,000 people in Town B, we might infer the people in Town A weigh significantly more than the people in Town B do.
Similarly, if we were to compare the household incomes of the 10,000 people in Town A with the household incomes of the 10,000 people in Town B, we might infer the people in Town A earn significantly less than the people in Town B do.
Then if we were to correlate all the weights against their respective household incomes, we might demonstrate they are inversely proportional to one another.
Thus, our statistical tests have used mathematics to convert our data into information. We have climbed a step up the DIKW Pyramid.
ANALYTICS
My shorthand definition of analytics is the analysis of data to identify meaningful patterns.
So while analytics is often conflated with statistics, it is indeed a broader expression – not only in terms of the nature of the data that may be analysed, but also in terms of what is done with the results.
For example, if we were to analyse the results of our weight-related statistical tests, we might recognise an obesity problem in poor neighbourhoods.
Thus, our application of analytics has used statistics to convert our data into information, which we have then translated into knowledge. We have climbed another step higher in the DIKW Pyramid.
DATA SCIENCE
My shorthand definition of data science is the combination of statistics, computer programming, and domain expertise to generate insight. Or so I’m led to believe.
Given the powerful statistical software packages currently available, I don’t see why anyone would need to resort to hand coding in R or Python. At this early stage of my re-discovery, I can only assume the software isn’t sophisticated enough to compute the specific processes that people need.
Nonetheless, if we return to our obesity problem, we can combine our new-found knowledge with existing knowledge to inform strategic decisions. For example, given we know a healthy diet and regular exercise promote weight loss, we might seek to improve the health of our fellow citizens in poor neighbourhoods (and thereby lessen the burden on public healthcare) by building sports facilities there, or by subsidising salad lunches and fruit in school canteens.Thus, not only has our application of data science used statistics and analytics to convert data into information and then into knowledge, it has also converted that knowledge into actionable intelligence.
In other words, data science has converted our data into wisdom. We have reached the top of the DIKW Pyramid.Written by our Guest Blogger, Ryan Tracey
Ryan Tracey is a learning experience designer based in Australia. He is a council member for the Australian Institute of Training & Development, and a former editorial board member for eLearn Magazine.
Ryan has worked in corporate e-learning for over 15 years. He holds a Master’s degree in Learning Sciences and Technology from the University of Sydney.
_________________________________
Copyright of posts written by our Guest Bloggers are their own.
Published on 18-Jul-2017