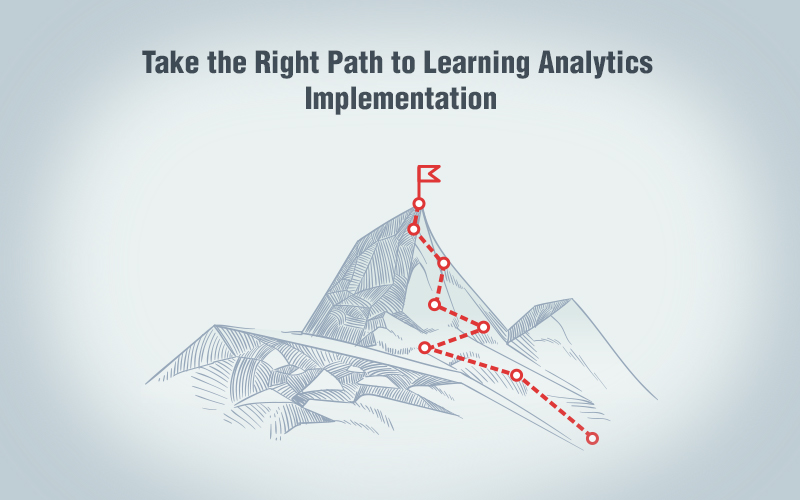
What is learning analytics? Do away with all the jargon and read this simplified explanation on learning analytics and its main components.
I say, “Learning Analytics”. Most training managers say, “What about Learning Analytics?” They have heard about it but don’t know enough about it. Alas! Most people in corporate L&D are still unaware of it even though it’s quite popular in the educational space. This is strange, considering how much organizations rely on data, analytics, and quantified information. Well, in their defense, there’s a scarcity of information about learning analytics and how it works.
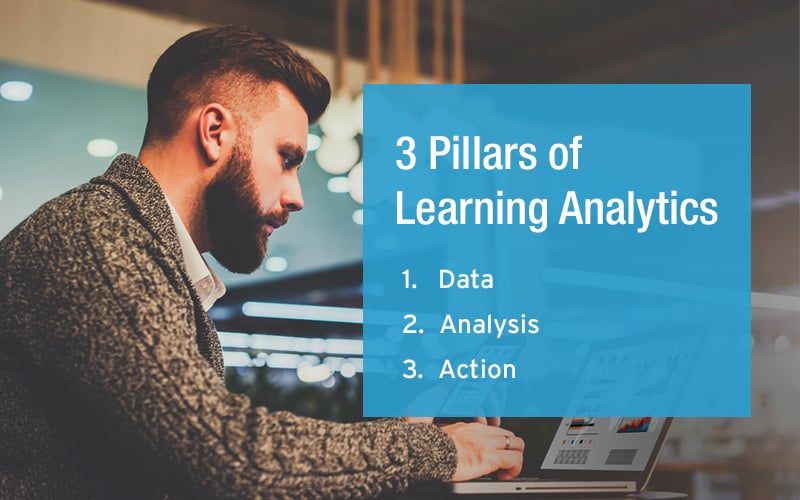
3 Pillars of Learning Analytics
- Data
- Analysis
- Action
And whatever information is out there is so mind numbingly technical that no L&D professional would like to touch it with a ten-foot pole. So, here’s an overview.
| “Learning analytics is the measurement, collection, analysis, and reporting of data about learners and their contexts, for purposes of understanding and optimizing learning and the environments in which it occurs.” – SoLAR |
3 Elements of Learning Analytics
Data, Analysis, and Action – these are three elements that work together for Learning Analytics.

‘Data’ represents all the information gathered from learners and the learning activities they take part in. ‘Analysis’ involves putting together all the gathered data and measuring the effectiveness of the training on the organization’s productivity and progress. And finally, ‘Action’ is the decisions you take and changes you make based on data analysis.
Data
The value of data in today’s world can’t be understated. We generate 2.5 quintillion bytes of it every day. From the suggested playlist in your music app and the news in your feed, to whether you get a loan approval from the bank – everything is determined by data that has been or is being recorded and reported.
Considering the data around online training, you’ll find that the LMS captures more than enough of it to get your organization started on the Learning Analytics journey. You can also pool in data from the HR Information System, surveys and polls, supervisors’ reviews and user (learner)-generated social learning content.
But what should this data focus on? The individual learner, the learning experience, or the entire training program? The answer is – all three. These are the questions that can be asked under each head, based on inputs from Watershed.
Learners
- Has everyone in this group completed all the mandatory training programs?
- What skills does this person/group have?
- Where are the gaps?
- Who needs development?
Learning Experience
- How much of the learning is being used?
- Is there “scrap learning” that isn’t being used?
- When is it being used and for how long?
- What resources or topics do learners search for most?
Learning Program
- Has organizational performance improved because of the training?
- Has this method of learning saved the company money?
- Which learning methodology is more effective?
Analysis
After you have gathered data about learners, their experience with training, and the training program, the next step is to analyze it and obtain actionable insights. This is the step which might be a two-fold problem depending on your organizational practice.
- Many businesses have data but lack the resources, instruments, and strategies to analyze it.
- Most organizations who do take the trouble of analyzing the data, limit themselves to course completion and passing percentages.
The first problem can be solved easily enough, though the solution will depend on your monetary investment. If you’re a small or medium scale business, you can hire analysts who can put the data together and compile reports based on their findings. For large businesses, analysts alone won’t be enough to handle the data. There are analytic tools available now which make processing large chunks of data much easier.
The second problem is a bit more complicated for a variety of reasons. Analyzing learners’ activities during training is not enough to measure the effectiveness of training. You’ll need to analyze their performance pre- and post-training, and this is where team managers’ and stakeholders’ inputs and insights are essential.
But most stakeholders outside of L&D don’t give much importance to these details. Most of them rely on the L&D team for getting their employees trained, with little to no interference from them. So to overcome this obstacle you’ll need to talk to all stakeholders, make them aware of the benefits of training evaluation, and ask for resources (both human and technical) which will make implementing learning analytics possible.
Action
All your analytics and calculations will come to naught unless followed by action. It doesn’t matter how good or bad your predictions are if you are not willing to or are unable to act on them. Your learning analytics is incomplete without implementing changes based on the presented reports.
For instance, what will be your plan of action if analytics points to a failed learning process or low-quality training content? In such cases you will need to re-evaluate the content as well as the instructional design strategy and modify them to fit the training requirement.
Download this eBook to become a master of instructional design strategies.
The best strategy to get desirable action is to adapt a training evaluation model which works at each level of training. The Kirkpatrick Model is a widely accepted model which, if followed properly, can give really useful actionable insights.
Let’s take an example of product training for a sales team. The ongoing training program follows a blended learning strategy.

In this hypothetical scenario, here’s how the Kirkpatrick Model will work.
| DATA | ANALYSIS | ACTION | |
| REACTION | Learners’ rating is 7/10 in feedback sheets | While learners are satisfied with the overall curriculum, they find the performance support videos too lengthy. | Performance support needs to provide instant information. So lengthy modules need to be chopped into microlearning. |
| LEARNING | LMS findings show that learners are taking more than the estimated time to finish the challenge and are at times skipping ahead. | Questions asked in the challenge are not aligned with the information provided in the training. | Align assessments with learning objectives. |
| BEHAVIOR | Supervisors observe that learners who have hands-on training perform better than others. | Product animations, though informative, fail to give practical experience. | Let learners take the basic product training followed by hands-on training. |
| RESULT | The overall revenue generated by the sales team in the financial quarter is 20% more than the last quarter. | The present training is able to increase employee performance, but they still need to improve to reach their target. | Continue with the blended learning strategy and fix the glitches and requirements within the training. |
Summing It Up!
Learning Analytics is one of those eLearning trends which when put in practice can transform your training program. It will measure the effectiveness of training, hold it accountable, and secure training budgets. Learning analytics is also the best way to optimize your company’s ROI.