Courses in Moodle take by and large a pretty much prominent role. And Moodle course reports make you inspect how the learning experiences are. You get a good number of Moodle reports out of their courses, if only you require to assess their and their folks’ learning (or, training) patterns.
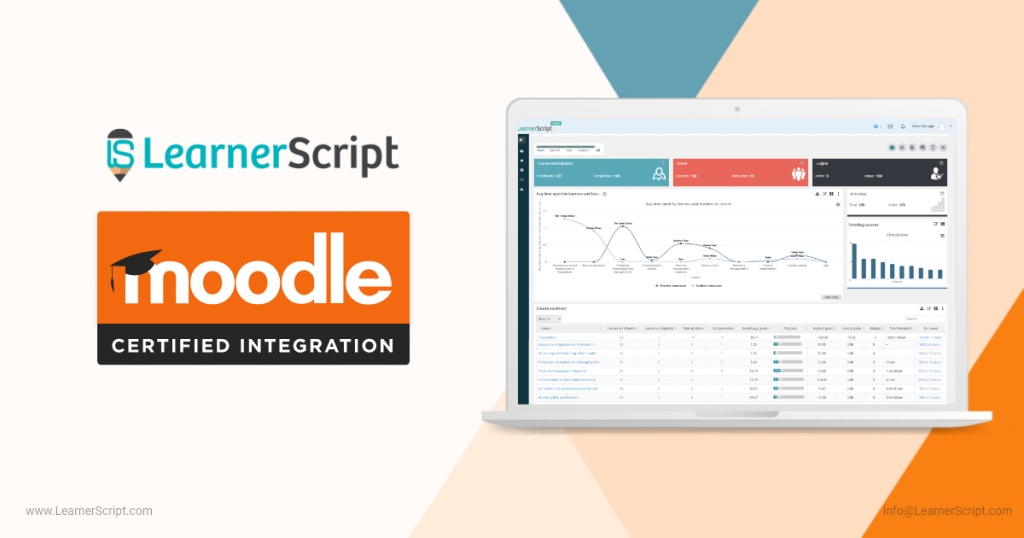
This blog post presents to you some of the most common Moodle course reports. Interestingly these 9 Moodle reports are available on LearnerScript, the Moodle analytics tool, as the Canned Reports.
Right, let’s get started with the nine Moodle reports related to the analytics of courses.
#1. Course Activity Summary
This report summarizes all course activities in a single report, with all the related course metrics.
A course in general consists of a good number of activities. The activities include assignments, quizzes, BigBlueButton, files, wiki, surveys, and a variety of others. All of such activities share some common ‘Activity Metrics.’ The gist of the Moodle analytics here includes the number of views, the progress of the activity, the completed learners, the different grades, and the total time spent.
Nevertheless, it always depends on what analytics you look for from your Moodle log data.
So, why focus on this Course Activity Summary? Simple. If your folks are not good at individual course activities, they can’t be faring well at a course level overall.
To Moodle educators like you, LearnerScript offers this Moodle report as a default report so that you use it right away. More than that, the report columns are completely customizable to incorporate your reporting requirements.
#2. Course Competency Summary
Competencies are attached to each activity of a course. Or simply, each course will have competencies in general. Whether to have a competency or not, that’s all decided by the teacher/manager.
The competencies translate to the ‘skill level’ in layman terms. The Moodle-based learning/training focuses on Competency-based Education (CBE). That is, a teacher on your Moodle LMS has the ability to decide whether to add a competency to an activity or the course itself.
So all the competencies related to a course show up in a report. Teachers/managers can check who has completed which competency.
To add more a bit to this Moodle report, educators can customize it using LearnerScript. With the customization of the Course Competency Summary, see who achieves what level of ‘skill’ in that activity in that course.
Visit the demo site of LearnerScript to learn more about this Moodle report.
#3. Course Participation
Don’t you want to know, how many completions have happened out of the enrolments at the site level, at any given period? In such a case, the Course Participation report comes in handy for you.
On LearnerScript, this Moodle report is visible as a tile/static report. This report provides that crucial information as a ‘snippet.’ As the enrolments increase to courses on your Moodle, then there will be a change in the number of completions as well.
With the same metrics, LearnerScript allows you to make a dynamic, custom report, if needed, with the addition of graphs and charts.
#4. Course Performance | Topic-wise
Students’ course performance matters above everything else. As you know, a course comprises a number of topics. The assessment of individual topics contributes to the ‘learning experience’ of your folks.
In the Course Performance report, check each student’s progress in each topic of a course. Likewise, do for all the students who have enrolled in that particular course. Thus, this Moodle report shows topic- and course-wise performance for any student.
Also, see the performance (topic-wise) of your folks enrolled in their respective courses available in your Moodle LMS. On LearnerScript, there is a course filter to see the analytics of the desired course. Check through this Moodle report on the demo page of LearnerScript.
#5. Course Profile
A Course Profile outlines courses in general. So, what’s the use of this Moodle report? Your L&D may consist of a good number of courses on your Moodle LMS. How do you know about a course in brief when you want to know?
How do you make a comparative analysis of courses? How do you know why a certain course fares well, but others do not? Think of such many of questions for which you figure out answers by using the Course Profile report.
By and large, the Course Profile showcases the number of enrolments, completions, progress of the course, various grades, badges, total activities, total time spent on it, enrolment methods, and sundry.
It’s possible to custom this list of items in this Moodle report. In other words, include what you want to see on the Course Profile. The kind of custom-friendly tool is one and only LearnerScript.
Moreover, do make a comparative analysis of two or more courses at a time on LearnerScript. Check over this Moodle report on the demo page and know for yourself first-hand.
#6. Course Views by Learners
Course views of your students help you know how they engage themselves with the courses they enrolled in. This Moodle report shows up the number of hits (= the times visited) by your student.
LearnerScript includes the course filter so that it makes searching for things easy for you. Search through the filter to get the views analytics by a course. And notice which of the learners engages themselves more and those of which do not.
What is the advantage for you here? You will learn one crucial insight from this report: notice the learners who poorly engage themselves in their courses.
#7. Course-wise User Time-spent
Just the Course views by learners matter?No, right! The Course-wise User Time-spent reports the amount of time spent on it by its learner. The time spent here is the total one.
Again, like some of the reports mentioned above in this list, search it for by a course-wise. For each course, you’ll find out the most amount of total time spender and the least total time one.
If you use this Moodle report from LearnerScript, you will have an instant messaging option within this report. It helps you communicate with your folks whether to appreciate their effort or encourage those who are at-risk learners.
And all this process goes on a course-wise.
#8. Courses
Do you want to know how many (overall) courses are available within a period on your Moodle LMS? Then the Courses report helps you in this regard. As per this report, as it is on LearnerScript, the Courses report displays the total courses available, active, and inactive ones in a period.
That means the total, active, and inactive courses may change on your LMS from time to time.
Check over on the demo page of LearnerScript how this Moodle report works and helps you in L&D.
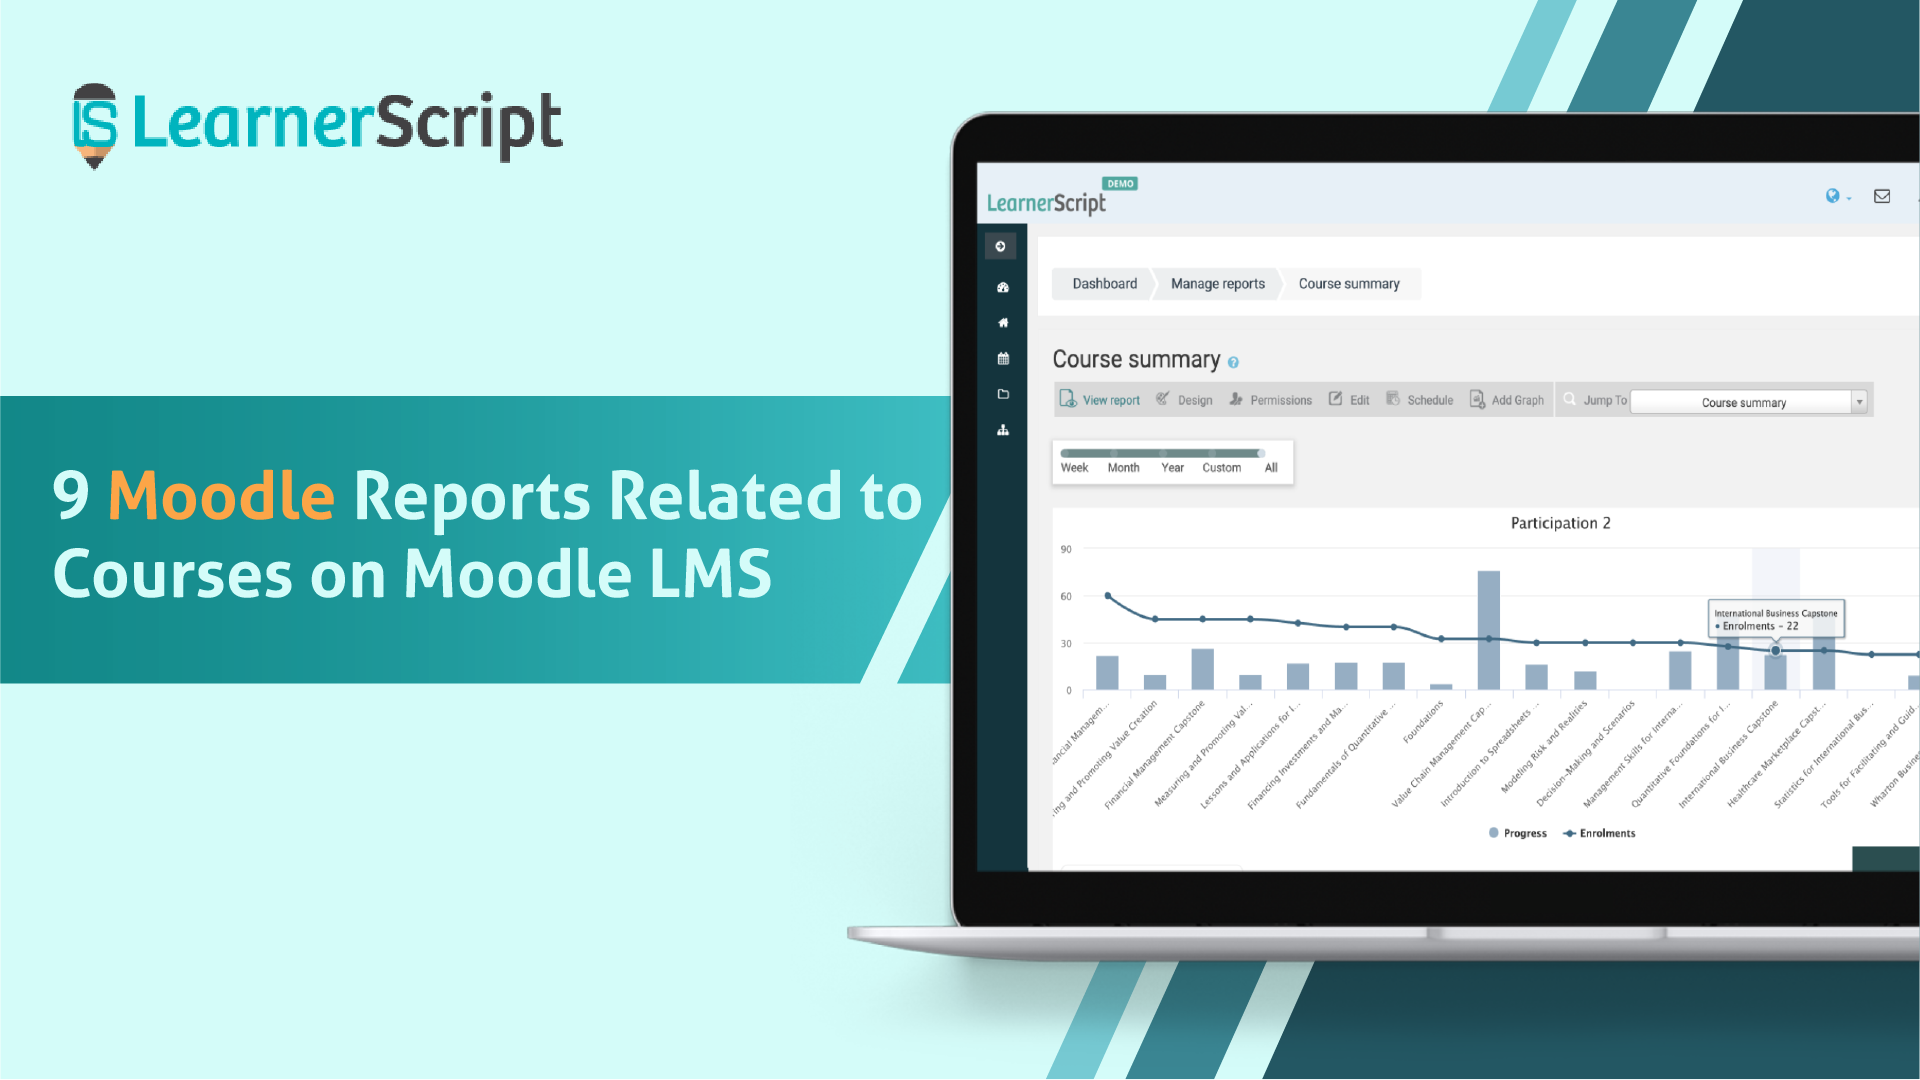
#9. Course Summary
“When there are individual course reports which provide learning analytics, why again do we need the Course Summary report?” you might ask! That’s the right point to inquire. But do you know that there will be other columns as well in the summary report such as badges, progress, various grades, etc.?
If you use LearnerScript for Moodle analytics, then drill down most of the components in this Summary report for further analytics.
This Moodle report presents learning analytics for all the courses available on your Moodle. Otherwise, if you want to know the summary analytics for a particular course, then go by the search option.
Moreover, unlike the other analytical reports, the Course Summary report is a site-wide report available on the main dashboard of the Moodle admin.
That’s all about the nine Moodle course reports. All these reports are available on LearnerScript as the default reports. Also, these are custom-friendly. If you want to customize any column, it’s absolutely possible on LearnerScript.
Check through LearnerScript’s demo pages to explore this Moodle plugin further.