


The ability to build your own data source is one of the main attractions of Zoola Analytics. Unlike other reporting solutions, you aren’t limited to the provided data sets. Instead, you can build your own.
We have recently updated the user interface (UI) for our data source designer, here’s what’s new:
While the overall experience is generally the same, there are ‘less clicks’ to complete tasks in our new Data Source Designer, and the overall performance and responsiveness is greatly improved.
The first thing you might notice is that the ‘front page’ of the data sources has ‘disappeared’, and when you edit an existing data source, you will be taken directly into the data source designer.
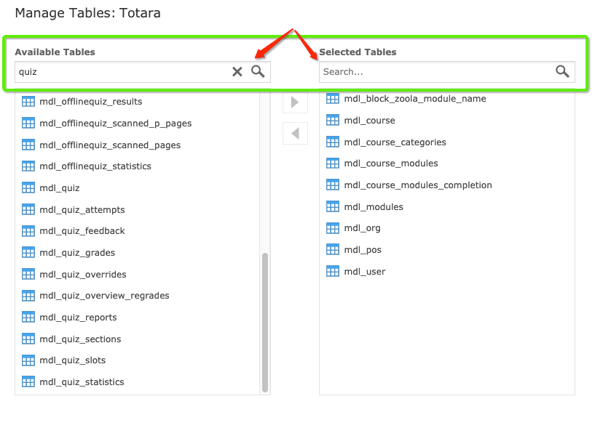
Where the Tables tab used to be, you’ll now find the Data Management tab, where you can add or modify the tables in your data source. With the new UI, you can now search for tables!
This is also where Derived Tables can be built. In the old UI, Derived tables had their own tab, but now you can simply click the + sign in the upper left to add a derived table to your data source.
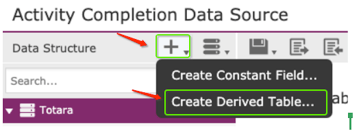
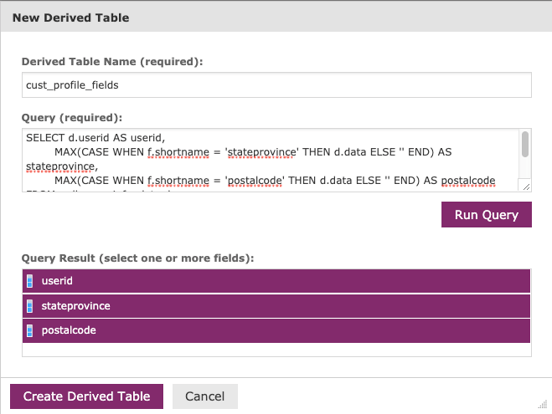
When you click on Create Derived Table, you’ll see a pop-up where you can add your query.
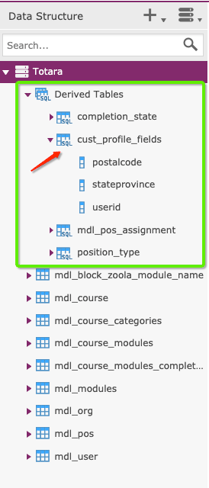
Then you’ll see derived tables listed under the Data Structure panel on the left, noted with the “SQL” icon on the table:
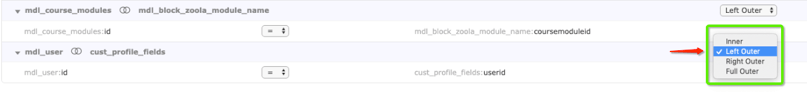
The Joins panel now provides a drag and drop experience. Here, you simply drag the fields you want join from the Data Structure panel onto the canvas and then select the type of join you want to make from the drop down.
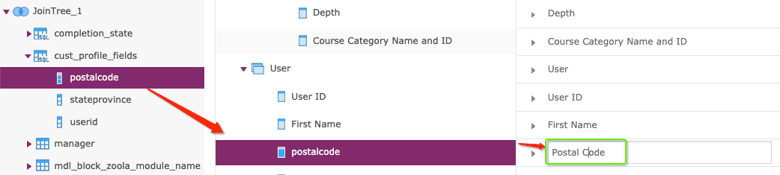
Finally, the Display tab has been renamed to Data Presentation and has a clearer format for editing labels for your Ad Hoc View. You can easily drag and drop your fields to where you want them to sit in the Ad Hoc View fields panel and then edit it
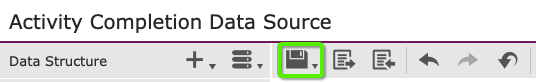
When you are finished creating or editing your data source, the save icon is available from any tab in the data source designer and is in the control ribbon:
We think you’ll enjoy the new data source designer! Let us know if you have any questions.
Watch our webinar on What's New in Zoola Analytics with a special focus on Data Sources
Contact us today. We’d love to help you create a better way to learn!

Other resources you might be interested in:
- eCommerce Integrated LMS: Turning eLearning into a Revenue Stream
- 5 Factors to Consider When Selling Courses Online
- The eCommerce and LMS Solution for Nonprofits
- How to Solve Your Challenges in eLearning: ROI, Integration, and More
- How to Sell Online Courses and Make Money with Your LMS
- How Can I Scale My eLearning Business?
