


Reporting Strategy #1 - Ask for help
Even for those with learning analytics experience, reporting can often feel like a complex and frustrating task. Unfortunately, there’s no getting around the fact that reporting can be difficult! When it comes to interpreting data, there’s rarely a one-size-fits-all solution, and beyond a certain number of fields, tables, visualizations and other choices to be made, complexity becomes unavoidable.
So, the more you can do to keep reporting simple from day one, the more efficient and stress-free the process becomes—leading to faster, better learning insights.
One easy way to simplify the process is to build a supportive culture around your analytics program. Enlisting a data analyst, from either inside or outside your organization, makes it less likely that you’ll experience roadblocks when building out new reports.
The experience of data experts can be called upon to run queries or read schemas when you need a surer hand at the wheel, which in turn allows reporting newcomers to feel more confident about growing into their own role (see strategy #5).
 Alongside data experts, internal sponsors of your learning analytics program can help create a culture of data nerds! (Information source: Brent Dykes, Forbes Magazine).
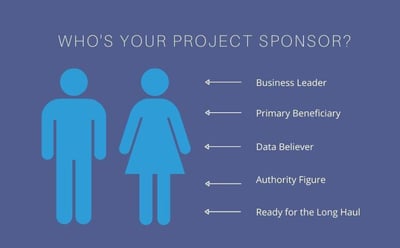
A champion of your learning analytics platform from higher up in the organization can be really useful. Having an executive sponsor—ideally, someone from the business side of things—can work to ground your program in legitimate organizational needs. This makes it clear to everyone how reporting is intended to create returns.
The best data project sponsors are those who already believe in the power of reporting, and are likely to derive some kind of direct benefit from your reports—think managers and directors who have a stake in training, or the eCommerce side of your eLearning program.
In addition, executive-level sponsors should be people with the leverage to address any data shortages or blockages. That way, if there’s a lack of data in some area, your sponsor might be able to help free up the resources needed to collect it.
If you’re still looking for your own team of data experts and champions, don’t fear. Stewart Rogers, VP of Product at Lambda Solutions, recently hosted an Ask Me Anything (about) Lambda Analytics “Zoola”. Curious about how to use a feature? Or how to create a specific report? Or maybe you’re just interested in a general conversation about learning analytics? Talk to us!
Reporting Strategy #2 - Get a feel for what’s possible (with out-of-the-box reports)
Sometimes, with so much data on hand, it can be hard to choose a starting point. A simple strategy for forging a path through your data (mine)fields is to begin with an out-of-the-box report. Lambda Analytics “Zoola” users can take advantage of a variety of pre-made reports, which give you instantly organized data. From there, insights may already be obvious—or those reports can provide the inspiration needed to make your own alterations.
A single report or data source can speak to many different areas of your eLearning program. An Activity Completion Breakdown, for instance, can be used to develop information on a specific activity, a comparison between courses, or inform a study of learner engagement. For some examples of the types of reports you can generate with data gathered by your Moodle LMS or other eLearning platforms, check out this article covering What Are The Most Important KPIs for LMS eLearning?  Out-of-the-box reports are not only a great place to start; they can also lead to original data findings. (Source Wikimedia Commons, CC BY-SA 4.0).
The key to really understanding the possibilities involved in LMS reporting is to spend some time in an Ad Hoc View designer. In this format, L&D teams can play with data, using drag-and-drop tools to experiment with different configurations of information, and different ways of expressing learner interactions.
Our webinar for Ad Hoc Views users: How To Utilize Data To Improve Operational and Learning Effectiveness.
When playtime’s over, showing your insights in a visual form is the easiest way to communicate data to a general audience. Heat maps, for example, can give instructors an instant understanding of where or when learners are most engaged. So, it’s worth experimenting with graphical representations of data alongside the data itself.
Reporting Strategy #3 - Use an Artifact Dependencies reports
This reporting strategy tip becomes relevant when you’ve already built a bunch of reports, but you’re not totally familiar with your analytics platform. Perhaps you’re still new to learning analytics, or you’re not a daily user—or (most likely) you’re too busy to keep track of everything that goes on within the platform.
An Artifact Dependencies report pulls together the reports and data sources you’ve used previously. It reveals the connections between finalized reports and the data that feeds them, allowing you to see how everything links together. This makes Dependencies reports the simplest way to keep astride of things, by using it as the launchpad for building upon previous work.
Let’s say you’re looking for the data source(s) behind a report you made last year—or vice versa—all of the reports made from a particular data source. This tip lets you quickly see the information you need, and make any changes or updates in the Ad Hoc View.
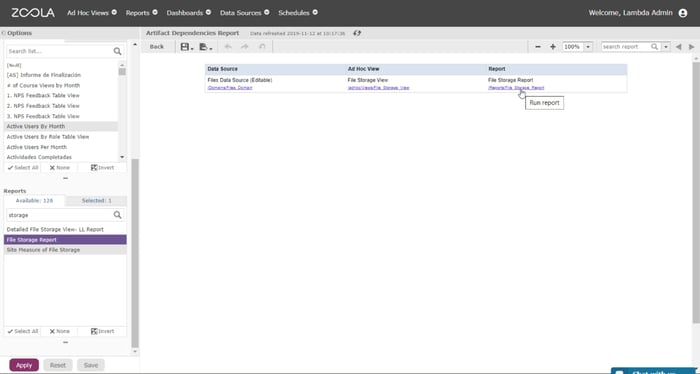 Artifact dependencies reports give you a view of the connections between your reports, your Ad Hoc Views, and your data. (Source: Lambda Solutions).
Artifact Dependencies reports also make it more simple for you to respond to new report requests. Looking at previous successes will help you get to know which reports and sources will work best for different organizational levels.
For example, the next time a department manager requests a dashboard reporting of KPIs with progress updates, you can review the data sources previously used to build similar dashboards, giving you a running start. Or, if an instructor requests their own version of a report you developed for another member of the team, you can pull up the data recipe in seconds.
Reporting Strategy #4 - Understand what you (or they) really want
While strategy #2 might be the best way to drag and drop your way to data conclusions, it’s often the case that reporting requests are narrower, more formal, and coming from an external source.
In these cases, you can simplify the process by beginning with clear lines of communication. Members of other teams might not know what analytics can do for them, nor the right questions to ask, or even what databases are available. Without a conversation about needs and expectations, this can result in a confused and overly complex analytics process.
Here are a few questions you could consider asking those who request reports:
- Who or what do you want this data for? (This may also help to inform the way you present reports or dashboards.)
- What business impact do you hope this report will have?
- After you receive the report, what are your next steps going to be?
As this article from HBR points out, learning analytics results are often only as good as the questions being asked. So it’s important to pinpoint the fundamental needs at hand, rather than pursuing indirect pathways—for example, running reports to determine new enrollments, when what you really need to find out about is longer-term user retention.
Once you’ve decided what data, fields, and categories are the most relevant, apply the same focus to your choice of visual presentation. Lambda Analytics Dashboards, for instance, are a simple way to keep team members informed about multiple data points.
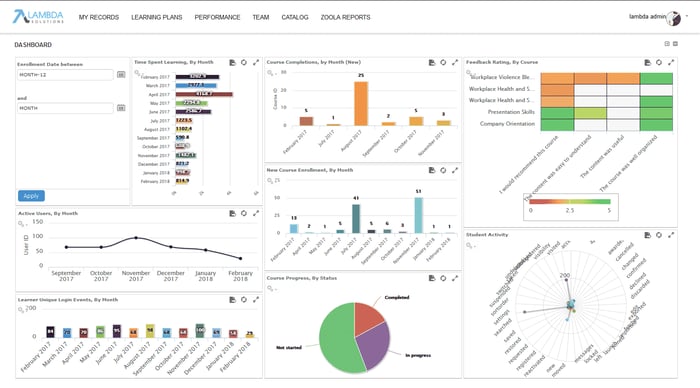 Dashboards visually represent data stories on a large number of learner characteristics (click here for more dashboard examples), from learning effectiveness and engagement, to feedback and instructor KPIs. (Source: Zoola.io).
Reporting Strategy #5 - Be confident! (and have confidence in pre-existing course structure)

Repeat after me. You cannot break anything in Lambda Analytics “Zoola”. One more time? It’s worth saying again, because knowing that you can write reports all day long, and not affect your LMS in the slightest, should give data newcomers the confidence they need to begin independently building experience and skills.
It also makes things more simple if you have confidence in the existing structure of courses on your LMS. Replicating the hierarchy of data as it’s organized on your Moodle and Totara site means you can match up course categories, modules, activities, and data points on the analytics side of things. When there’s a lot of data to deal with, this helps retain clarity on how all the building blocks fall into place. If (or when) things start to go sideways, errors then become much easier to see and correct on a modular basis.
For more advice and insights into LMS Reporting and learning analytics, watch our webinar—on the Top 5 Tips for Keeping Reporting Simple.
Ready to keep climbing down the Learning Analytics and Reporting rabbit hole? Here’s what we’ve got for you:
-
eBook: LMS 101: Learning Analytics
-
eBook: The Practical Guide to Evaluating Your Workplace Learning Effectiveness
-
Webinar: How To Utilize Data To Improve Operational and Learning Effectiveness
-
Article: What Are The Most Important KPIs for LMS eLearning?
-
Article: The Most Beneficial metrics for eLearning and Why You Should Track Them
-
Article: Healthcare Analytics: Why Educators Are Using Blended Learning and Big Data in Healthcare
-
Article: Analytics Reporting: How to tell if your quizzes are passing the grade
- Article: 5 Reporting Strategies for Moodle You Need to Know
