
Understand more about a key feature of Captivate Prime’s tracking capabilities. The specially created Dashboard Reports offers six templates designed keeping in mind the importance of aligning training with business goals. Understand how to create these reports, subscribe to them at regular intervals, and share them with managers.
ABOUT DASHBOARDS IN PRIME
As a Learning and Development professional you collect information about your training programs, their success, and the performance of employees across the organization. You use this data to map learning objectives with learning goals and organizational goals.
The Reports feature in Adobe Captivate Prime makes various levels and kinds of reporting available to you, enabling the above. Of these there are some that (we find) are common across organizations and industries.
These top-level reports are available at the Dashboard level in Prime. Log in as Admin and navigate to Reports. Of the four tabs available, the Dashboard Reports tab opens.

Prime’s Dashboard feature, the first level of reporting, is unique in its click-to-use, readymade graphic representation of data. Typically, these templates are reports that most organizations across industries and stages of maturity require.
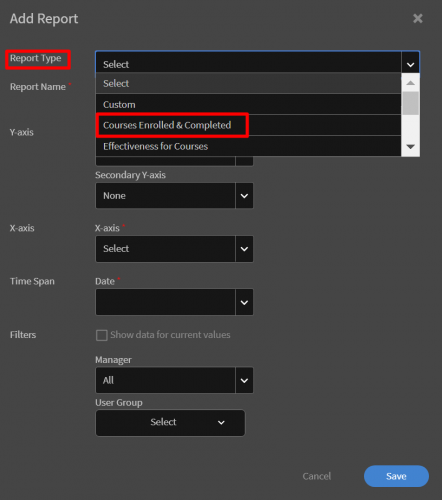
To explore and create reports for your Dashboard, click on Add and select the type of Report you want to create. Select the various parameters and click Save.

Scroll down for:
- An Overview of Dashboard Reports – a few lines about the various Dashboard Reports.
- Use Cases– understand when and how to create the different types of Reports.
- Singular Features of Dashboard Reports.
OVERVIEW OF DASHBOARD REPORTS:
There are six report templates created to provide frequently required and/or commonly useful information:
Courses Enrolled & Completed
A Report that gives you data such as the number and names of courses enrolled in and of those, how many Learners have completed them.
Effectiveness for Courses
Course effectiveness is calculated after gathering L1 (learner feedback), L2 (quiz scores), and L3 (manager) feedback. Feedback ranges from Level 0 (no feedback) to 5 (highest level of feedback)
Learning Programs Enrolled & Completed
This is a report that provides information at the Learning Object level. It helps understand the success and popularity of your Learning Programs (LPs) and conversely the difficulty/unpopularity of an LP.
Learning time Spent per Course
This Report shows how much time learners spend on a given Course. This information helps in the planning of future courses and in the assignment of courses to learners.
Learning Time Spent per Quarter
Learners may be required to spend a stipulated number of hours on learning and upskilling. This report provides a bird’s eye view of how much time learners spend on training programs.
Skills Assigned and Achieved
Another bird’s eye view report, this one gives a broad perspective on how many skills have been assigned to learners and of those how many have been achieved.
USE CASES
Courses Enrolled & Completed
This report allows you to track courses across the organization and find out which and how many have been enrolled in and of those, how many completed by your learners. For example, if you would like to know how many courses have been enrolled in/ completed/ left incomplete, across all your managers’ groups, you would follow the steps below:
- Log in as Admin, navigate to Reports –> Dashboard Reports, select the Dashboard in which you want to add the report, and click on Add.

- Select the Report Type – “Courses Enrolled & Completed”
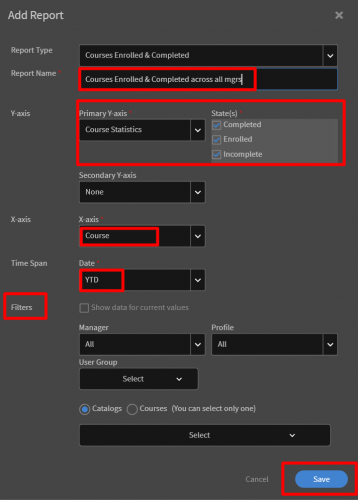
- Give the Report a name. Choose your Y-axis – “Course Statistics” (and check all the states in the box: completed, enrolled, incomplete)
- Choose an X-axis – “Course” (to include all courses)
- Choose a Time Span – any – depending on how far back (1 month to 1 year)
- Choose a Filter
- Hit Save

Your new Report on Courses Enrolled & Completed will be saved in the specified Dashboard.
You can further edit and customize the report/ graph if required. E.g. You can include a secondary Y axis and further filter the data using the Filters given.
Effectiveness for Courses
As mentioned in the Overview, effectiveness of a course is based on:
L1: Feedback from learner
L2: Scores from Quizzes
L3: Feedback from Manager
To generate a report on the effectiveness of courses, follow the same first step as in Courses Enrolled & Completed, except that in the Report Type Drop Down menu, select Effectiveness for Courses.
You can customize the report by changing Y-axis and X-axis values and adding Filters, just as above.
Learning Programs Enrolled & Completed
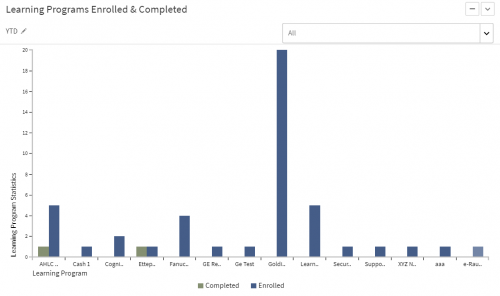
Follow the same procedure as in Courses Enrolled & Completed. In the Report Type Drop Down menu, select Learning Programs Enrolled & Completed.
The graph generated will have two bars. As indicated in the legend, one indicates the Learning Programs (LPs) completed and the other indicates the number of LPs enrolled in.
This information combined with the information on the effectiveness of the courses and learning time spent should provide some insight into the correlation between enrollments and completions.
A higher correlation between the number of enrollments and number of completions indicates a well-received LP. The same information tells us also about the difficulty/unpopularity of the LP – if there is a low correlation between the two numbers (enrollment vs. completion) this could possible indicate that the LP is too difficult or unpopular.
Learning Time Spent per Course
Follow the same procedure as in Courses Enrolled & Completed. In the Report Type Drop Down menu, select Learning Time Spent per Course.
This information can be used to understand phenomena such as course completion rates, differences in learning time spent by users, etc.
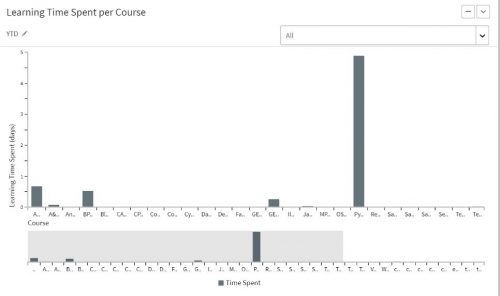
For example, if learners are spending more time than anticipated on a course, you will know that the course needs to be modified to enable learners to spend less time on it. Conversely, if they are finishing the Course too fast, you can modify it to meet your time requirements.
This is a sample bar graph representation of the report on Learning Time Spent per Course. The Time Spent is measured in days.
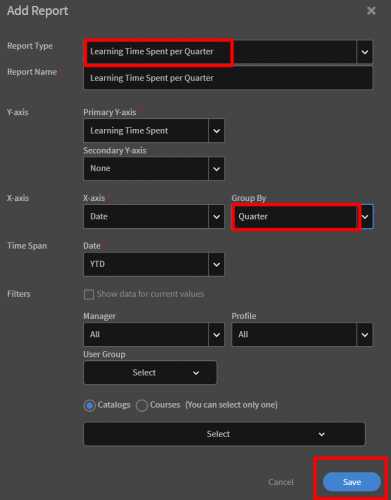
Learning Time Spent per Quarter
You want to know how many hours are being spent by learners on organizational training. You have certain training hour requirements to be met. If you group learning hours by quarters (three-month periods) you will get a higher view of the total number of hours spent on learning.
Follow the same procedure as in Learning Time Spent per Course. In the Report Type Drop Down menu, select Learning Time Spent per Quarter.
Under the X-axis, select Date and in the second drop-down menu next to it, select Quarter. Click on Save.
Skills Assigned and Achieved
Every Learning Object in Captivate Prime is associated with a Skill. The achievement of a Skill depends on the completion of certain Learning Objects which are weighted with a certain number of credits.
Achievement of credits –> Levels 1, 2 & 3 of a Skill –> Achievement of Skill.
To generate a report on the assignment and achievement of Skills in Prime, follow the same procedure as above. In the Report Type Drop Down menu, select Skills Assigned and Achieved.
The graph that is generated shows two bars: one indicates the Skills achieved and the other the Skills assigned. The X-axis has all the Categories of Skills as created in Prime.
Singular Features of Dashboard Reports
Customize a Dashboard
The Dashboard in Prime allows you to customize your own Dashboards. You can create, for example, a different Dashboard for every group in your organization, with reports relevant to them.
Steps to create a custom Dashboard:
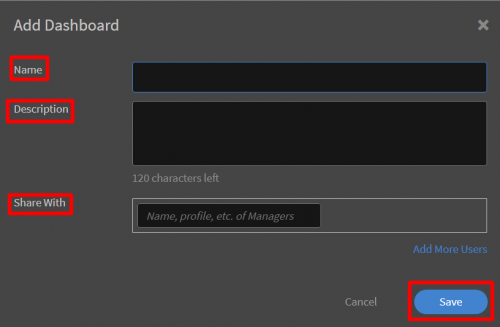
- On the Reports landing page click on Add Dashboard.
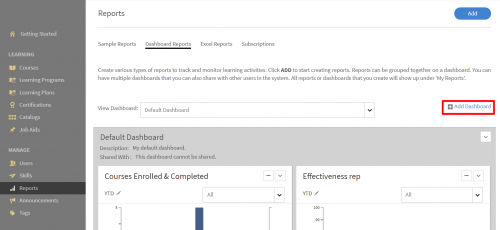
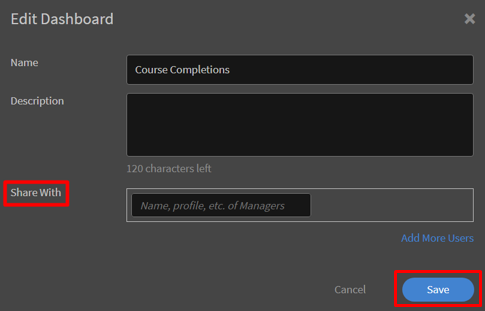
In the window that pops up, enter the Name of the Dashboard you are creating, the Description, and whom you want to share it with. Click on Save.
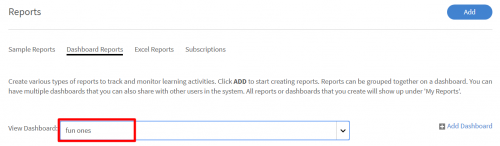
- You can locate your new Dashboard on the Dashboard Reports page in the View Dashboard drop-down menu.
- The ‘Sharing’ feature below explains how you can then share a Dashboard with a manager.
Share a dashboard with a manager
Now that you have created separate dashboards for your various teams and managers, you can share them with the respective managers.
This is beneficial to a manager as they can then keep track of how well their team is performing on various training programs/ learning objects.
From a bird’s-eye perspective, an Admin gets to monitor how all the various teams and groups perform with respect to each other and according to their own goals and objectives.
To share a Dashboard, follow the steps below:
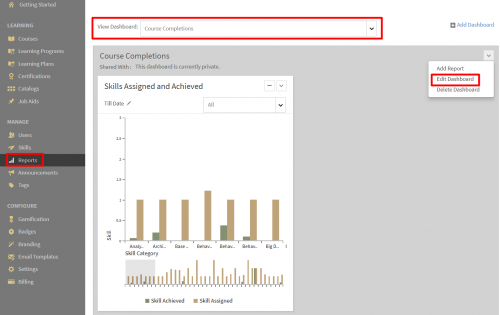
- Select the Dashboard you wish to share. Click on the drop-down menu in the upper right corner of the Dashboard. Select Edit Dashboard.
- In the window that opens, enter the names, profiles, etc. of the managers you would like to share this Dashboard with. Click on Save.
Note: You cannot share your Default Dashboard. You can only share Dashboards that you create/customize.
Subscribe to reports
Once you create a report (and save it to a Dashboard), you can “subscribe” to any reports you wish to receive on a regular basis.
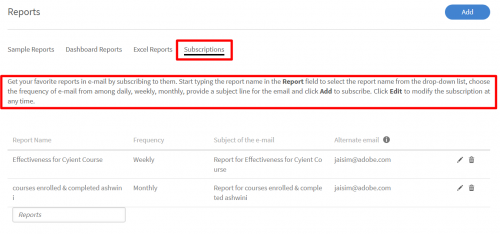
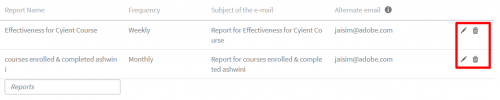
On your reports page, under Subscriptions, you can subscribe to several reports and monitor them here. You just have to type in the name of the report you wish to track, select the frequency at which you would like to receive this report (daily/weekly/monthly), enter the subject of the email in which it will come to you, and provide an alternative email id.
Follow these steps:
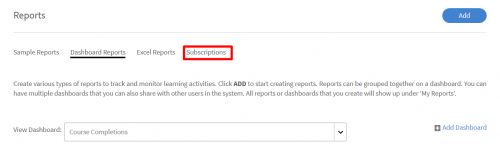
- On the Reports page, navigate to Subscriptions.
- On the Subscriptions page, follow the directions to:
- Select the Report you want to subscribe to.
- Choose the frequency of the subscription.
- Provide a subject line for the email (it will be delivered to you via email) and click Add.
- You can modify/delete the subscription at any time by clicking on the icons to the right of the Report details.
In Conclusion
The philosophy behind these features and the singular nature of Dashboard Reports is that as an Admin or a Manager, critical and useful reports are available at your fingertips. By using these reports, you can avoid large and unwieldy data downloads which then must be painstakingly converted into reports and graphs.
You must be logged in to post a comment.