
How well is your business doing?
Talk about a loaded question…
However, as an online course creator or membership site owner, it’s one you should be able to confidently answer.
Healthy, thriving membership site owners know their projected revenue, customer retention rates and lifetime value, as well as their conversion numbers.
One of the most efficient ways you can start tracking these metrics is by creating a dashboard that displays all your most important numbers at-a-glance.
With the help of a metrics dashboard and LMS reporting, you can easily gather the data necessary to help drive decisions, and detect any leaky buckets or holes in your customer’s journey.
Knowing these numbers is not only key to the success of your business, but also to the success of your members.
What Metrics Should You Be Tracking For Your Membership Program?
The best metrics to be tracking in your membership site might look similar to your business-wide metrics, and can include any of the following:
- Member churn rate so that you know, on average how many customers you’re losing each month.
- Customer lifetime value so you know how much money your membership program is taking in versus how much you’re spending to maintain and advertise it.
- Revenue forecasting so you can project how much money you can expect to earn in your business in the next year.
Not sure what metrics are best for your setup? Click here to learn about the 11 tracking metrics examples of metrics for membership site owners.
Let’s take a closer look at 4 metrics tracking solutions you can use to support you in growing your membership site.
What To Look For In A Business Metrics Dashboard Software Solution
The ability to analyze sales data, get insights on your projected revenue, and knowing your retention and churn rates will help you maximize your revenue and keep your customers coming back for more.
There are 4 key areas you’ll want to see included in your metrics tracking tool for your membership site and online courses. They are:
- Revenue and sales, this will help you get a clear picture of exactly how much money your business is bringing in.
- User-related stats, to keep a pulse on the number of members you have (free and paid).
- Abandoned cart data, to gauge the effectiveness of your checkout process. (According to Statista, 75% of people abandon their cart when they click the “buy now” button…that’s a lot of valuable data for your ecommerce setup.)
- Subscriptions, that help you measure the success of your offers.
AccessAlly
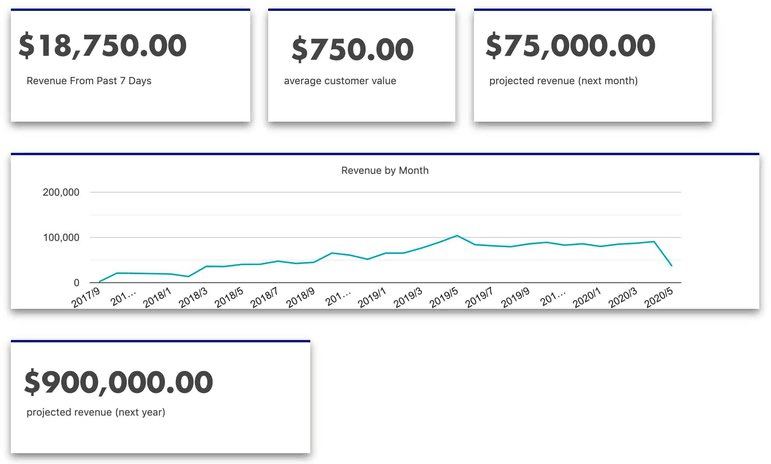
AccessAlly is an online course and membership plugin for WordPress that comes equipped with a built-in, customizable metrics dashboard to help you gather the most crucial data for your online courses and membership site.
This KPI dashboard design allows you to get a complete understanding of your numbers, from big picture stats to drilled-down metrics.
The great part about this setup is that you can pick and choose which metrics are displayed, creating a fully customized dashboard that’s tailored to your business
You can see the full suite of metrics available in AccessAlly here.
Revenue and Sales
A great number to start with is your total revenue, which is the sum of all payments. This will help you get a clear picture of exactly how much money your business is bringing in.
You can use forecasted revenue projections for the next month and year to help you understand your growth trajectory and if you’re on track to reach your revenue goals.
You can also track the number of cancellations and total refunds and refunded amounts so you know at a glance how many members you’re losing to each.
You can also track affiliate sales, and sales generated from specific promotions from within your AccessAlly metrics dashboard to understand how effective your affiliate program and promotions are in generating revenue for your business.
User-related Stats

These stats will help you understand how long your members are staying committed to your membership and will help you understand where your opportunities for growth lie. You can use these insights to develop a membership retention strategy.
For example, if you notice engagement and retention peak around the 3-month mark, you can craft a retention campaign to provide additional support and motivation shortly after their 2nd payment to increase the longevity of your memberships and provide additional value to the customer.
You can also use lifetime value to understand exactly how much each customer is worth to your business so you can determine how much you should be spending to acquire each customer to maximize profits.
Abandoned Cart
AccessAlly displays the number of orders that are initiated and completed vs. abandoned. This can give you the insights you need to checkout process, and put a follow-up in place to recapture some of those lost sales.
Subscriptions
The number of active, canceled, and completed subscriptions (if you offer payment plans) will help you track trends over time. This will help you attribute the activities and promotions that are bringing in the most revenue, but also spark improvements in your retention campaigns so you can improve the lifetime value of each customer.
AccessAlly also includes a custom calculation/advanced option so you can add metrics specific to your business into your dashboard.
Schedule a free discovery call
Find out why AccessAlly is the WordPress course plugin that pays for itself.

Who it’s best for
There are a lot of great metrics available within AccessAlly to help you monitor and improve your membership site model. AccessAlly only tracks metrics from its own plugin, so you can only use it if you’re an active AccessAlly subscriber with the plugin installed on your site.
It’s also ideal if you sell bulk courses or recurring subscriptions, because you can offer metrics and progress tracking to organization administrators.
All metrics will be displayed on the same dashboard (although it does allow you to create sections to help organize).
MemberMouse
MemberMouse is another membership plugin for WordPress with a built-in reporting suite so you can track your most important membership site metrics.
Revenue and Sales
MemberMouse’s reporting suite also includes sales reporting data such as total revenue, sales reports for a given date range, sales by product, and customer value for each traffic source.
You can also see the total sales by each payment system if you use a combination such as Paypal and Stripe. This is helpful in understanding which gateway is most popular amongst your members, in the event you want to reduce your expenses by reducing the number of tools in your tech stack.
You can also track sales by channel, which is key in understanding which activities and promotional channels are driving the most revenue for your business.
User-related Stats
The MemberMouse reporting suite tracks your total number of members, average customer lifetime value, and retention rates.
The graphical representations are great for helping you understand your membership site growth in relation to the number of members over time, not just revenue growth.
You can also monitor your member engagement rate in pages per day to spot trends and work to increased engagement on your slower days.
Abandoned Cart
This is one of the key metrics currently missing from MemberMouse’s reports. The fact that it does not track abandoned cart data, can make it difficult to analyze and improve your checkout process and recapture lost sales.
(If you do have an abandoned cart automation set up, you might be able to manually figure out the data by reviewing how many abandoned cart emails were sent out, and checking to see if the recipients made a purchase after receiving the info.)
Compare the top course & membership platforms
We’ve done the research, so you can make the right decision for your business.

Subscriptions
MemberMouse tracks average daily or monthly revenue, as well as customer churn rates, so you can ensure you’re not losing more customers and revenue each month than you are adding.
MemberMouse does not include a built-in projected revenue metric. Projected revenue helps you forecast your financial earnings over the next few months, and year. This metric helps you determine whether or not you’re on track to reach your revenue and growth goals.
Who it’s best for
The reporting suite by MemberMouse is only available to MemberMouse customers. Since it provides a wealth of valuable data to improve your membership site, the metrics dashboard itself can be a huge comparison point when you’re deciding what membership software is the best fit for your business.
For more comparison points, read our WordPress membership plugin comparison post.
ProfitWell
ProfitWell is a 3rd party SaaS tool used to report subscription metrics for your business, and ultimately, your membership site.
ProfitWell integrates with your payment gateway, rather than your membership platform, so its’ metrics are very revenue and sales focused.
The ProfitWell dashboard displays a high-level overview of some of the most popular metrics you want to be tracking for your members.
You’ll also find a recent activity feed with real-time updates about your member’s actions from new customers, customers who have churned, and those who have recently upgraded or downgraded their plans.
Revenue and Sales
Revenue and sales stats are graphically and numerically displayed in your ProfitWell metrics dashboard, so you can see exactly how much revenue has been generated from new, and existing sales. Additionally, you can view the upgrades, downgrades, and churned members that contribute to this number month after month.
ProftWell also does a great job showcasing the breakdown of your metrics month after month in a table format so you can easily track your growth from month to month.
User-related Stats
ProfitWell provides insights for your active and inactive users based on revenue generated from each group of members, indicating what percentage of forecasted revenue is at risk due to the possibility of those inactive members churning.
You can also easily see which members are the most active broken down by course and membership levels.
You can also track trends in customer activity from month to month on a weekly basis.
Abandoned Cart
ProfitWell does not currently track abandoned cart data so you’re not able to optimize this part of your customer’s journey, potentially leaving thousands of dollars on the table month after month.
Subscriptions
Like the other tools we’ve compared here, ProfitWell tracks monthly recurring revenue, churn, customer lifetime value, and retention rates for your members.
Who its best for
If you’re using one of the payment gateways from their integration list (which includes Stripe, Braintree, Zuora, Chargebee, and Recurly), ProfitWell might stand out as one of the top contenders for tracking your membership site revenue and sales data. (You may also be able to integrate via API if your developer can set this up for you.)
If you use multiple payment gateways, ProfitWell does not aggregate the data so you will be required to manually combine them.
Baremetrics
Baremetrics is another 3rd party SaaS tool built to integrate with your membership site using a third-party tool such as Zapier.
Similar to AccessAlly’s setup, Baremetics gives you full control over your metrics dashboard.
Similar to ProfitWell, Baremetrics provides you with a live stream of all activity from sales and subscriptions. You can even see at a glance a breakdown summary of new signups, churned customers, upgrades, and downgrades on your main dashboard.
Revenue and Sales
Baremetrics does a great job visually displaying your revenue and sales metrics, specifically forecasting revenue.
The graphical representations show cash flow projections based on current MRR and ARR and growth.
You can also calculate your projected revenue by plugging in custom growth percentages and churn rates. For example, if your goal is to reduce your churn rate to 4% and increase your growth by 10% for the next year, their custom calculator will generate your projected income based on those numbers to help you plan and set goals for the next year.
Baremetrics provides you with a full account summary of each customer’s financial account activity.
It does, however, take things one step further and reports your payment processing fees on your main dashboard.
It’s common for membership owners to focus on the revenue number, but not account for the payment processing fees automatically deducted from the incoming revenue which will slightly skew your perception of the total amount of money actually hitting your bank account each month.
User-related Stats
While Baremetrics is really great at tracking sales and revenue data, it falls short on the user-related stats for membership site activity. If this is important to you, you’ll have to depend on your learning management system or membership software to provide that data, or use an additional 3rd party tool for these metrics.
Abandoned Cart
Similar to the other tools compared here (with the exception of AccessAlly) Baremetrics also doesn’t include data on users who initiate checkout but end up abandoning their shopping cart.
Subscriptions
Baremetrics also displays churn in terms of users and revenue which are both important to consider, especially as you’re evaluating your membership growth in terms of revenue. If you’re losing monthly members, but gaining more annual members, your revenue churn percentage may offset your member churn percentage.
Who its best for
What Tool Is Right For Your Business?
Let’s get to tracking!
You don’t want to be caught with your pants down the next time someone asks you how things are going with your membership site.
And, with the help of one of these KPI dashboard tools, you’ll be plugging up the holes in any leaky buckets and giving your members the best possible experience with your brand.
If you’re interested in a personal, behind-the-scenes tour of AccessAlly, schedule a demo with our team today.
We’re here to answer all of your questions metrics and membership site related to help you find the best membership and learning management system for your business.