Graphics in eLearning simplify complex content. This blog looks at a taxonomy to plan for graphics in our eLearning based on their communication function.
We spend countless hours choosing the right content and instructional strategy before developing an eLearning course. Similarly, while planning the visual elements of an online course, we need to ensure they are included to make the course easily comprehensible to learners and simplify complex components. Graphics in eLearning add value by reducing cognitive overload and support learners using imagery that lingers in their memories for long, easing learning and retention.
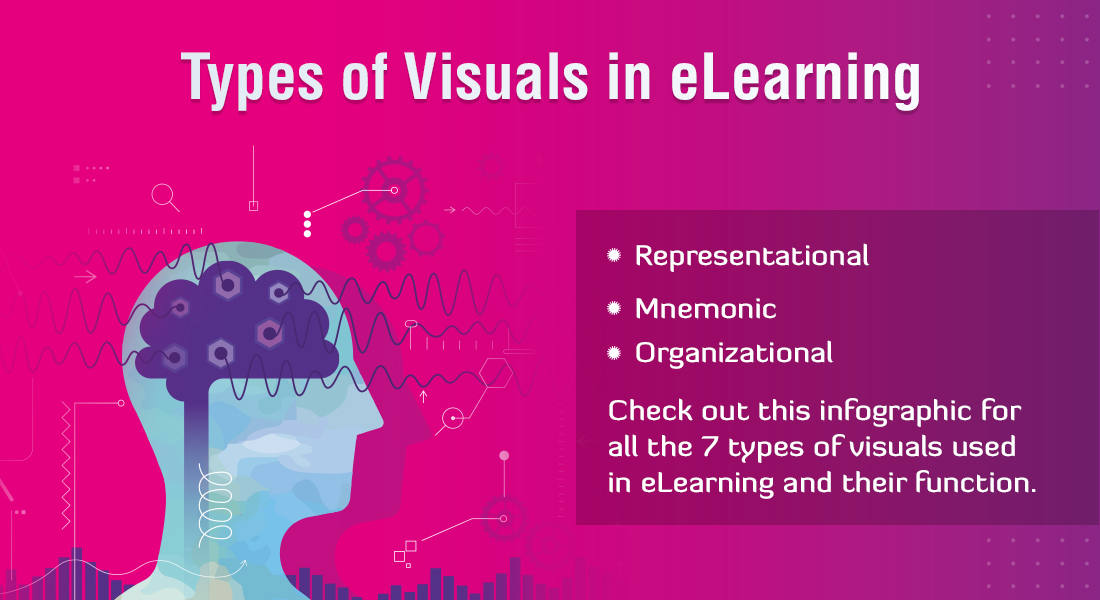
7 Functions Graphics Serve in eLearning
- Decorative function
- Representational function
- Mnemonic function
- Organizational function
- Relational function
- Transformational function
- Interpretive function
Ruth Colvin Clark and Chopeta Lyons in their book “Graphics for Learning” look at a taxonomy of graphical elements by Carney and Levin that will help us plan visuals for eLearning courses based on their communication function. According to Clark and Lyons, the seven key communication functions of visuals are decorative, representational, mnemonic, organizational, relational, transformational and interpretive. Let’s have a look at each in detail.
The Seven Key Communication Functions of Graphics in eLearning
1. Representational visuals to illustrate content in a realistic manner
The goal of representational graphics in eLearning is to illustrate onscreen objects or scenes, thus helping learners relate to the subject quickly and easily. Mostly employed to present concrete concepts such as functioning of an equipment, safety measures in a workspace, or various parts of a product, where we need visuals to depict reality, representational graphics give high fidelity to the real-world object as in a screenshot or photograph.
For example, in a product training course for service technicians, the various parts of the product can be illustrated to technicians through simple line drawings. This offers learners engaging content that plays a great role in knowledge retention. Using line drawings, you are also at the advantage of omitting extraneous details and purely sticking to content relevant to the learner’s understanding.
Other examples of representational graphics are:
- Illustration of an automotive engine
- Screen capture of a software application
- Photograph of a hazardous scene
2. Mnemonic visuals for the recall of knowledge
After days or weeks of rolling out an eLearning course, when learners are actually set to execute the acquired skill or knowledge, possibilities are high for them to miss out on certain principles or steps learned. In the absence of a job-aid or performance support tool how can we help them tackle this situation?
Mnemonic visuals are memory retrieval devices that capture the meaning of complex concepts and facts and encapsulate them as another concept that’s similar and easy to remember. A mnemonic visual helps learners remember an idea with a pattern of numbers, letters, or relatable associations such as images, acronyms, or rhymes.
This visual analogy when used in an eLearning course will quickly capture learner attention and aid in the recall of knowledge, even days after taking the course.
The familiar the visual mnemonic, the easier it is for learners to recall related information. Let’s take the classic example of the ‘Story Arc Formula’. The story arc that acts both as a formula and a diagram is a handy tool that helps learners map or create a story of their own. A learner can visualize the story arc as a line that starts low during the exposition. The rising action within the story creates a rise in the line, followed by the height of the climax, after which the line dramatically falls, indicating the falling action.
This is an excellent visual mnemonic to help learners learn and remember how to map a story.

Image Source: Study.com
3. Organizational visuals to depict qualitative relationships
Typically represented in the form of charts, maps, or tree diagrams, organizational visuals depict the qualitative relationship between key concepts. A commonly used organizational visual in eLearning is the two-dimensional representation of a module structure that communicates the relationship among topics. This offers learners a quick overview of the content.
Another example can be that of a new hire orientation program where new hires are provided with an overview of the organizational policies, its structure, and functions. Using an organizational chart in onboarding helps us establish the relationship between different departments within the organization and enable new hires see where they fit in the overall company structure. This improves learners’ ability to comprehend conceptual relationships better than long sentences.
4. Relational visuals to establish quantitative relationships
We already discussed how visuals help communicate the qualitative relationship between concepts and facts. Relational visuals help us establish quantitative relationships with the help of line graphs, pie charts, and bar charts. Rather than dumping blocks of paragraphs filled with numerical figures and percentages, relational visuals in eLearning present the same in a clear and crisp model.
For example, imagine in a sales training program to educate them on the customer base through demographic segmentation – millennials, Gen X, and Gen Y customers. Here a bar graph can be used to easily divide customers into the three demographic segments and depict them clearly to learners.
5. Transformational visuals to teach skills involving motion
Studies have proved that animation can be superior to static images when teaching skills involving motion. Transformational visuals communicate movements or changes that take place over a period of time or over space. These can be in the form of videos, line drawings, or animations with movement indicators in eLearning.
A common example of a transformational visual is the supply chain management process. Here the process of moving goods from the raw materials stage through to the consumer can be communicated using a chart as shown in the image. Transformational visuals showing the stages in sequence give learners a clear understanding of the process.

6. Interpretive visuals to illustrate the abstract
How do we train learners on abstract and intangible concepts? Interpretive graphics in the form of line drawings or vector diagrams help us build learner understanding of concepts and principles that are abstract in nature. For example, an interpretive visual can be used to illustrate the idea of blood circulation through the heart. This provides learners a better learning experience than from text-only description.
Another example of interpretive visuals can be that of an image illustrating the movement of food through the human digestive tract and the subsequent muscle contractions that pass food to the different processing units within the tract.

Image Source: https://pmgbiology.com/tag/peristalsis/
7. Decorative visuals to hook learner attention
Self-paced eLearning courses are often subject to high learner attrition. Hence, “eye candy” decorative graphics are popularly used in eLearning to spice up the course and serve aesthetic and motivational purposes. For example, the image of a whole bunch of young, smiling employees being welcomed by a senior on the welcome screen of your eLearning course on employee onboarding.
Compared to other graphical elements, decorative graphics are extraneous to the overall goal of your eLearning course and are related only topically to the content. Apart from the fact that they serve no real instructional purpose, an overdose of decorative graphics might depress learning. Thus, decorative elements are recommended to be used sparingly in an eLearning course.
For example, using stock photos or an avatar standing in front of a course panel, which do not relate to the subject matter but may look nice onscreen. However, as the learner struggles to find the correlation between the text and the graphics, it hurts the learning process and depresses learning.
Hope this blog helped you get an idea of the taxonomy of graphical elements as proposed by Carney and Levin. The classification of graphical elements presented here is a starting point to assist you plan graphics the way you want them to communicate your eLearning content. Choose them appropriately and develop engaging and relevant eLearning courses.
Are you interested in other instructional design strategies that will help develop engaging eLearning courses with the efficient use of available resources? Take a look at this eBook to understand the importance of instructional design strategies in eLearning.