


Dashboards are an excellent way to quickly gain insights into the most important aspects of your data. With integrated filters, you can easily slice and dice your data across different reports at once.
For more information on dashboards and filters, look at some of our previous webinars:
Dashboards are made up of a collection of dashlets or reports, and to successfully integrate these reports, make sure that the filters you want to use across each report in your dashboard match. For example, if you want to filter your reports by course, then you need to ensure that each report has the exactly the same filter.
For this example, we’ll use the Course Full Name and ID field as a filter across three different reports. We have set this filter up with the operator “Equals” because we want to view the end results by one course at a time.
Reports used in this example:
- Course Engagement Chart View
- Course Completion Table View
- Time Spent Learning
Instructions:
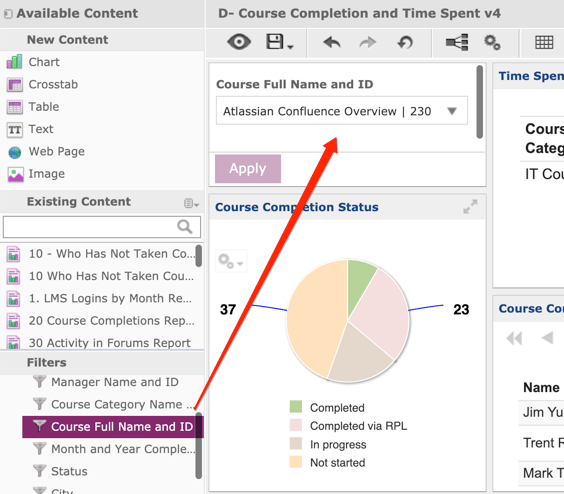
- Drag and drop the filter of your choice (here, Course Full Name and ID) from the Filters panel to the Dashboard Designer Canvas:
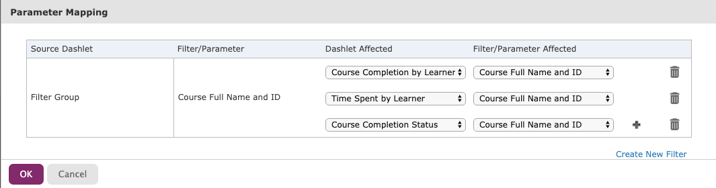
- Select the Parameter Mapping icon from the control ribbon:

- Click the + sign on the right of the pop-up to add a new filter choice:
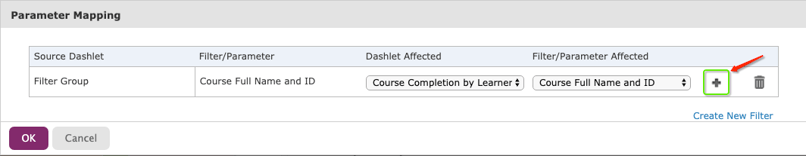
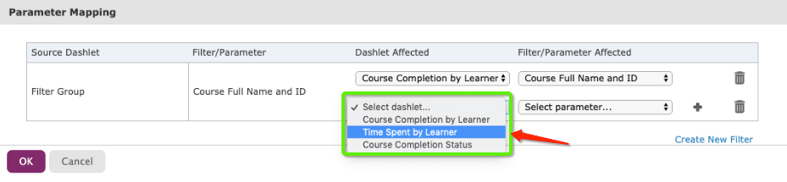
- From the dropdown under Dashlet Affected, select one of your other dashlets:
- From the dropdown under Filter/Parameter Affected, select the Course Full Name and ID filter.
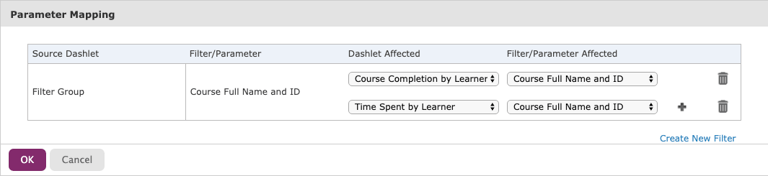
- Repeat steps 3-5 to capture your third dashlet. Click OK to save your new parameters.
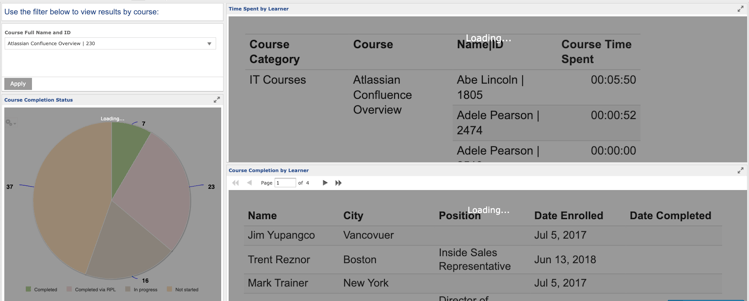
- Click the Preview icon on the control ribbon to try out your filter:

Once you select your filter and click Apply, you should see each of the dashlets loading. This is a good sign! That means you’ve successfully mapped the parameters.
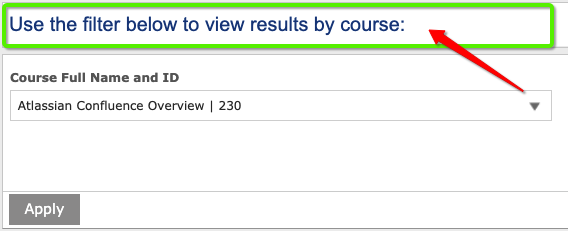
It can also be a good idea to add a text box with instructions to use the filter:
Try it out! For this dashboard we used two out-of-the-box reports, and built a basic time-spent learning report using the Your Zoola Starter Data Source
Stay tuned! Next month we’ll show you how to use a chart as a filter in a dashboard.
Contact us today. We’d love to help you create a better way to learn!

Other resources you might be interested in:
- eCommerce Integrated LMS: Turning eLearning into a Revenue Stream
- 5 Factors to Consider When Selling Courses Online
- The eCommerce and LMS Solution for Nonprofits
- How to Solve Your Challenges in eLearning: ROI, Integration, and More
- How to Sell Online Courses and Make Money with Your LMS
- How Can I Scale My eLearning Business?
