


The purpose of Learning Analytics is to better understand and optimize learning and the environments in which it occurs. Analyzing patterns, of, for example, time spent learning or enrolment numbers over a period of time, can be valuable for inspiring incremental changes for the better.
For example, as an LMS Administrator, I would like to see which days of the week I have the most active users so that I can plan extra support resources for those days.
Or, perhaps, you notice spikes in enrolment once a month and check that against a marketing newsletter highlighting new courses. This inspires you to spearhead a monthly email campaign to increase enrolment numbers.
The best format to assess patterns over time are charts, so for this example, we’ll use the Time Spent Learning Chart View. Going straight to the Ad Hoc View allows us to make changes to the level of detail.
By default, this report shows hours spent learning by month over the period of a year. I’d like to see hours spent learning by day over the past four weeks.
To accomplish this, go to the Ad Hoc View designer and do the following:
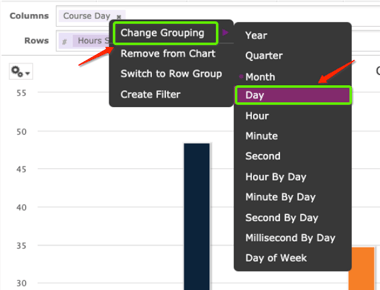
- Right-click on the Course Day field
- Hover over “Change Grouping” to open up the sub menu
- Select your grouping
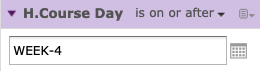
- Adjust date filter to create a readable match
Try it out on another report:
- Course Enrollment Chart View
- Course Completion Chart View
- Active Users Count Chart View
