Multitenancy Moodle and LearnerScript
Multitenancy in Moodle Learning Management System (aka Moodle LMS) is a big deal in many aspects of eLearning. The reasons for that for medium to large organizations are obvious and lucid – bringing their individual companies’ L&D under one umbrella LMS, with the least possible investment.
For that reason, the cost-effective multitenancy Moodle paves the way for the easy control and dispensation of L&D to each company within it, without the interference of them one another.
IOMAD, Workplace, and some Corporate LMSes are the best examples of multitenant Moodle platforms.
Okay, then. What about the multitenancy reporting?
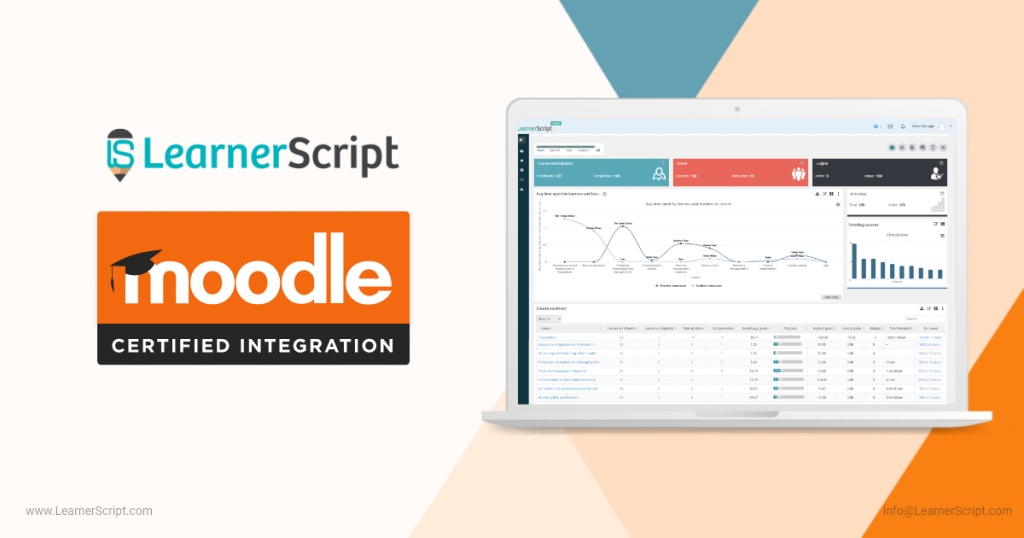
Keeping that in mind, eAbyas Info Solutions introduced LearnerScript, a Moodle reporting tool, which has no best alternative as some claim to have. This Moodle plugin provides Moodle analytics for plain Moodle LMSs, for IOMAD, and for other multitenant Moodle LMSs.
Come and witness this tool’s worth at demo sites, not just the mere words of us. LearnerScript has separate demo sites for plain Moodle LMS reporting and IOMAD Moodle reporting.
As we are looking at the multitenancy Moodle, here are some of the common Moodle reports useful for multitenancy platforms like IOMAD Moodle.
Let’s see one by one.
9 Common Moodle Reports for IOMAD Moodle
#1. Top Learners Report
The name itself suggests that this report shows off the cream of the crop. The Key Performance Indicators (KPIs) or calculations for which you measure them vary from one organization to another. Or they vary from one training/course to another.
Using combination graphs and bar charts, the Top Learners report can various aspects of the learning experience. It includes: completed activities, completed assignments, completed tutorials, completed feedbacks, and so on.
Overall, this report tells you about your learners’ competencies. That’s how good a learner is on the skills you train them on, and through which you expect to spearhead your organization’s growth, and as well as the training ROI.
The best of this report (or these reports) is customization. You/your technical staff can do that using this tool, without needing to spend extra bucks.
#2. Trending Graded Activities Report
The activity on your IOMAD Moodle can be anything: an assignment, a quiz, a SCORM package, a resource, etc. And these activities have to be graded. The Trending Graded Activities display the analytics department-wise for a company. That means, if you have ten departments in a company/organization, then there will be ten Trending Graded Activities reports. By simply changing a department, this report displays the respective analytics.
In a nutshell, a training manager will come to know which of the training activities are graded and trending and for what reason. So it will help trainers/managers to replicate the same learning method/process across the activities and the departments.
Thus, this Moodle analytics reports the worthiness of your training assessed through activities. For your folks replicate the same in their department once the training is over.
#3. Assignment Summary Report
This Moodle report provides a gist of learning analytics on ‘Assignments’ across courses in a department. If your organization has multiple departments, then you will only have to switch to a particular one for getting assignment analytics.
Assignment Summary includes insights such as course, submitted learners, completed learners, pass grade, avg. grade, time-spent, and so on.
And the assignments are listed along with their respective courses. There are non-graded learners as well. Again, it depends on what you want to measure from the assignments by your folks.
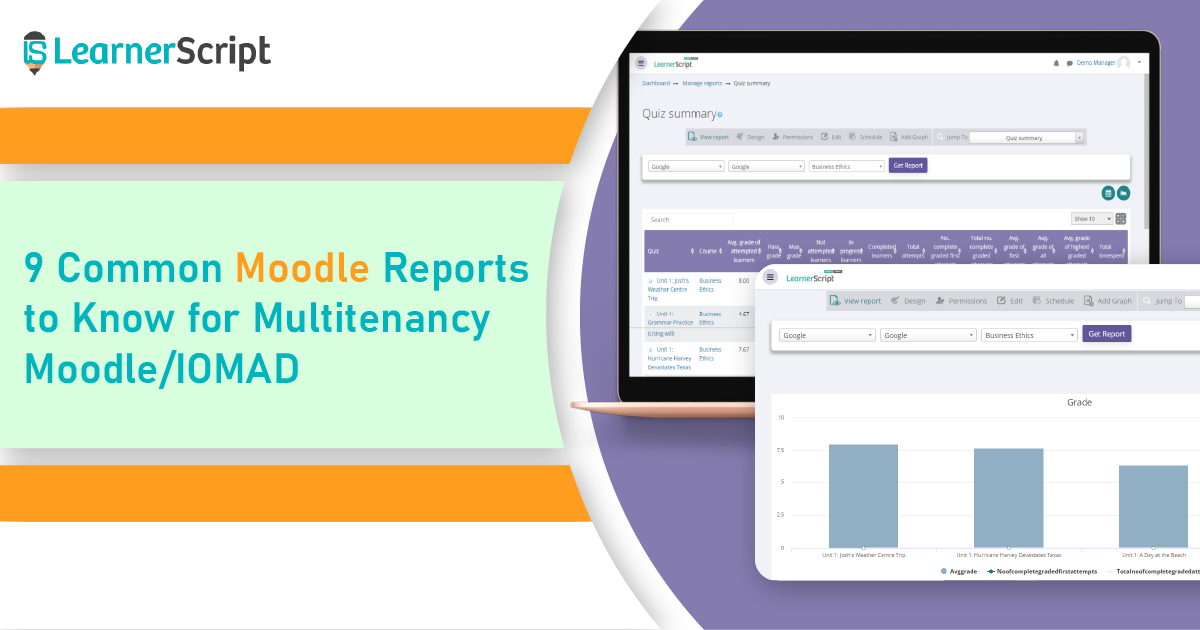
#4. Quiz Summary Report
If Assignment Summary and Graded Activities tell you about the ‘learning engagement’ of your folks, this IOMAD Moodle report talks on their ‘learning assessment.’
Assess your students through Moodle ‘Quiz Summary’ report with a baker’s dozen calculations. These learning metrics consist of grades, time-spent, total attempts, grades (max, avg. & pass), not-attempted students, completed students, etc.
So with this report, you’ll have the gist of learning assessment analytics at your hands. It’s up to you how you will make use of them for the betterment of your L&D strategies, eLearning courses, the ROI, and finally, the organization growth.
Know more about Moodle Quiz Analytics here and how they play a helpful role in the holistic growth of your folks and organization.
#5. SCORM Summary Report
The SCORM is a technical standard for eLearning content on LMSs. This Moodle report provides the learning analytics on the SCORM content usage by your learners. From the default report, get the analytics such as SCORM completions (or, completed students), time spent on a particular SCORM material of a course, and various grades (pass, avg., and max. grades).
Since this reporting tool fetches the analytics from your Moodle log data, custom the SCORM report to get what insights you want to draw from it. For example, individual learner time-spent on a SCORM material can be one of the key KPIs you can look for from this analytics.
#6. Average Time-spent by Learners and Teachers
How about knowing the time spent on a course by your trainer/teacher and learner/student? Then this is the Moodle report you need.
This Canned Report available on LearnerScript gives the gist of time-spent by a teacher and his student. However, the ‘time-spent by students’ can be the total amount of time spent by the number of students enrolled in that course.
However, the individual time-spent by learners is displayed in their Courses Summary report. Or can make this reporting customized by your technical team.
#7. My Forum Participation Report
If you want to know your learners’ Forums participation, then how? You know, of late, Moodle has put efforts to improve Forums in the platform.
My Forum Participation is for your learner. He (or she) will have it on his/her dashboard.
Through this Moodle report, your students learn about how they engage themselves with the training topics from discussing to questioning to answering. The default Moodle report on LearnerScript shows the number of discussions, the number of questions raised, and the number of words if answered any question for a forum.
#8. Learner Course View Report
The Learner Course View is yet another default IOMAD Moodle report which summarizes your learner’s total learning experience.
For example, take a course your learner enrolled to. This report shows the analytics such as the total number of activities in that course, in-progress activities, completed activities, the time spent in total, and of course, the grades.
He/she sees from this report the time spent on each activity or resource of a course.
To dig deep into their learning experience, drill-down various components from a course from the report for more insights. Overall, the Learner Course View fetches all the learning analytics pertaining to the courses enrolled by your learner.
#9. My Badges Report
Appreciation works even if it is temporary. My Badges report does exactly the same thing to your learners. It motivates to engage himself/herself more.
You learner will see here the badges he/she earned. A badge includes some information such as the badge issued by (admin or someone else), a brief description, how to achieve it, and the expiry date.
Plus, this IOMAD Moodle report lists out the course-wise badges to engage your learner to learn and to bag it.
In conclusion, LearnerScript is one Moodle reporting tool that provides you with all the learning analytics. Be it you have one Moodle site or multiple of them. Come and see how this tool works through its demo sites.
By the way, if you are interested in a personal demo about this Moodle reporting tool, just shoot a mail or drop a message to us.