


Following our webinar—Zoola Analytics: Creating Impactful Insights With Reports and Dashboards—this post takes a look at Learning Records Stores (LRS) and Application Programming Interface (xAPI). What do these terms mean, and how do they enable learning analytics?
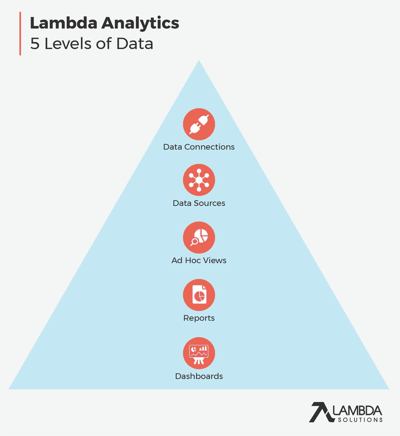 Inside Lambda Analytics “Zoola”, a five-level hierarchy of data stitches everything together. Scroll down or watch our webinar for more details.
What is xAPI?
Answer: Experience Application Programming Interface (xAPI).
What the… does that mean? Well, you could think of xAPI data as the internal language of an eLearning ecosystem.
It’s the component that allows all platforms and applications to talk to a server, and the server to find and send the right data to those platforms and applications.
In other words, Experience API (sometimes known as Tin Can API) handles requests sent to a server and issues a response. Those requests could take the form of data being received, sent, or both. xAPI data requests can come from any number of places, including:
- Non-launched learning experiences: activities that happen outside of a browser.
- Launched learning content: traditional eLearning courses, normally within an LMS.
- eLearning systems: other kinds of learning systems, like a next-gen learning platform.
(Source: Moving and receiving xAPI data in an LRS rich environment).
Within those three categories are a whole bunch of systems able to send and receive xAPI data, from Learning Management Systems and analytics software, to gamification apps, mobile apps, VR/AR platforms, and Learning Records Stores.
For a more in-depth look at the history of data interfaces and their uses, try our article on The Differences Between SCORM, Tin Can and xAPI: What You Should Use.
The benefit of using xAPI as an interface between all these systems is that it provides a tremendously powerful way of aggregating data. For learning analytics, this is super important—the ability to track progress over time, performance pre and post assessment, and engagement across a course, are all likely to lead to ROI-boosting insights.
The more organized data is, the more it becomes useful to a variety of roles. xAPI data is relevant to LMS administrators, course publishers, as well as those interested in ensuring the organization and security of learner data. Furthermore, both xAPI and LRS are open-source, which means they can be implemented in any internet-ready device.
 |
|
|
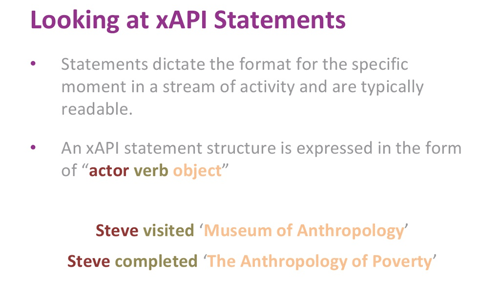
How Does xAPI send and receive all this data?
Answer: xAPI statements.
An Experience API statement is the format in which an API system stores and reads data about learners. That data is arranged in the same form as a standard English sentence — Actor-Verb-Object (AVO).
For example, a basic AVO statement might look something like this: Employee X (actor) passed (verb) Health and Safety training Quiz 1 (object).
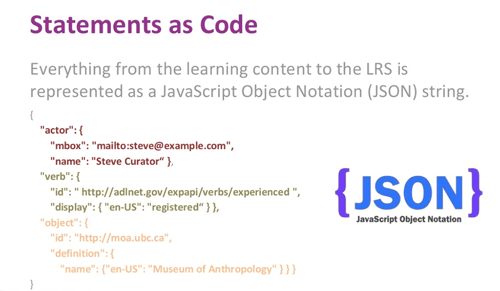 |
In reality, xAPI AVO statements are much longer, containing loads of detail about learners and their interactions with course content. Statements are also expressed in a common computer coding language, such as JavaScript. Taking the example above, a more realistic statement might read:
- Actor: Employee X, marketing assistant, in marketing team A
- Verb: Passed
- Object: Health and Safety training Quiz 1, with a score of 34 out of 40, at 11.00 am in training room Y, at location Z.
You can see where this is heading—detailed, organized xAPI statements increase the capability of learning analytics insights by providing modular, layered information, which is basically crying-out for analysis!
For example:
"On July 15, Steve worked the cashier position from 8 a.m. to 12 noon, he checked out 13 customers and sold two company memberships, a 15 percent improvement on his membership sales from his last shift."
Want even more on the basics and applications of xAPI? Read What is xAPI and why should you deploy it?
The Benefits of xAPIDistributed learning environments A universal data interface means that learner data can be easily sourced from multiple locations, platforms, and devices. The more data there is to analyze, the more accurate picture of learning. Better learning experiences When you know exactly how learners perform, where they learn best, and what barriers prevent learning, it becomes easier to optimize learning content and strategy. xAPI helps to build those insights. Mobile devices With mobile versus desktop usage increasing each year, it’s important to make content accessible across devices. xAPI helps create that all-important consistent user experience. When users switch from their computer to their phone, xAPI ensures their data is pulled across. Learning Analytics (the main driver behind xAPI) Connecting data together makes it far easier to see the whole picture when assessing the ROI of an eLearning program. For example, xAPI ensures that learner data is supplemented with information on job performance and related metrics. |
What is an LRS?
Answer: a Learning Records Store.
xAPI data and Information flows into the Learning Records Store from all aspects of an eLearning ecosystem—the LMS, a course, a web page, a game, or a data analytics platform such as Lambda Analytics.
Basically, an LRS is the data hub of an eLearning program. It’s capable of receiving and processing xAPI AVO statements, in the form of learning records. Data is then stored and aggregated in the LRS, retaining xAPI’s detailed level of organization, ready and waiting for use by educators, or analysis by L&D teams.
xAPI and LRS technology are extremely flexible, but within the eLearning industry, it’s most likely you’ll see them at work within an LMS integration. Housing eLearning, eCommerce, and data analytics under an LRS framework gives a comprehensive and powerful data landscape. This not only expands reporting possibilities, but also the ability to look forward and design improved future eLearning experiences.
What do LRSs and other eLearning platforms do with xAPI data?LRSs store xAPI data and communicate that data to other systems. They can
LMSs host and track eLearning content. Many platforms also allow users to analyze learner data from that content. Typically, they
Learning analytics platforms are designed to analyze the xAPI data they receive. They
(Source: Moving and receiving xAPI data in an LRS rich environment). |
Running an LMS doesn’t necessarily require an LRS. However, if you’re interested in aggregating data about your learners for reporting and analytics purposes, it's the tool you want to be considering.
So what does data organized through xAPI and LRS do?
Answer: a lot!
With all the data from a learning ecosystem safely stored, aggregated, and organized, it becomes possible to take full advantage of a learning analytics platform. When these data analytics tools get their hands on xAPI LRS data, they’re able to produce insights that benefit teams across an organization.
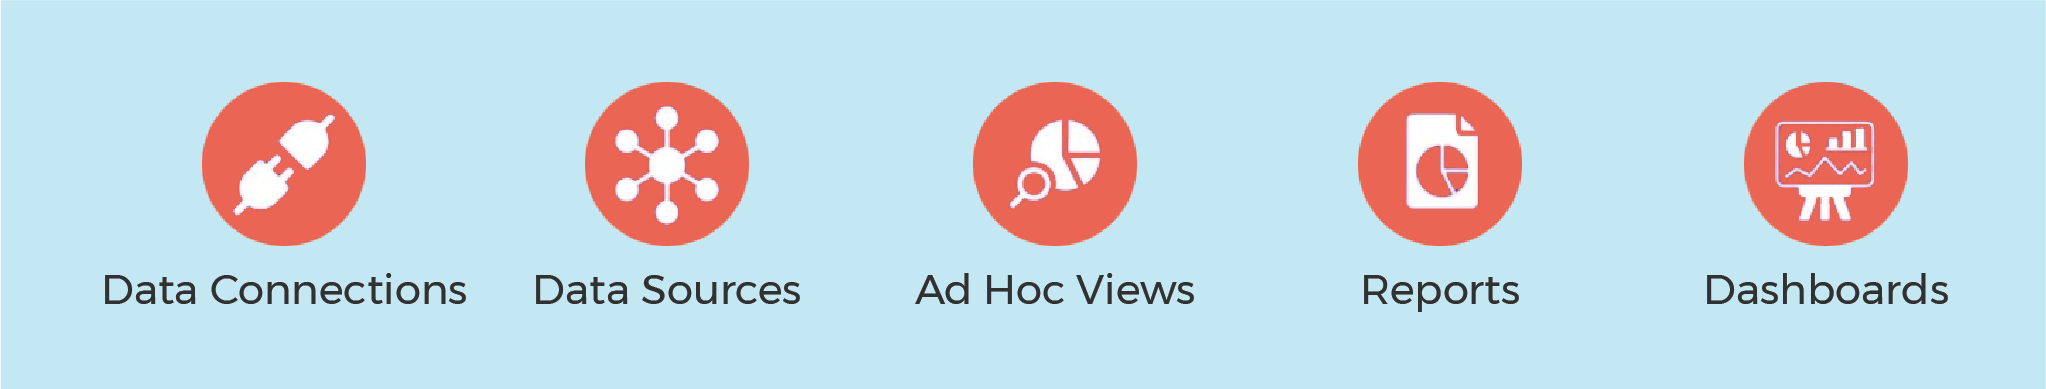
For example, Lambda Analytics uses a five-level hierarchy to stitch every piece of data and analytics insight together. The hierarchy takes initial data sets and turns them into a whole host of useful reporting outcomes, from ROI evidence for stakeholders, to updates for instructors, to meaningful objectives for course designers.
Learning Analytics Data: A Five-Level Hierarchy
5. Data Connections
This level is the connection between Lambda Analytics and the eLearning database. Data sources are created from the data connection.
4. Data sources
Data sources are a meta-layer built on top of the eLearning database. This layer provides even more organization—a clean view of information that allows you to do things like control access to data and set up the security.
3. Ad Hoc Views
The Ad Hoc View is Lambda Analytics’ drag and drop designer. It’s a space for exploring data, finding insights, and building reports. This level is a companion for designers, admins, and L&D staff—it’s intended for daily use on an ongoing basis, and is the point at which data becomes visual.
2. Reports
Once learning data insights are built, they can be dropped into reports for sharing. Reports are finalized versions of the Ad Hoc View, giving data a place to be presented and analyzed. To support this use, reports can be exported beyond the analytics platform.
1. Dashboards
The final level in the data analytics hierarchy is similar to reports, but dashboards are best for combining and presenting multiple data points into a single view. This gives dashboards a wide range of uses and audiences—for example, an instructor dashboard, to keep teachers up to date with everything happening in their courses. Again, dashboards can be embedded into whatever platform most promotes their visibility.
For a deeper look at what xAPI and LRS data can produce in Lambda Analytics, watch our webinar! Zoola Analytics: Creating Impactful Insights With Reports and Dashboards.
Keen to keep climbing down the Learning Analytics rabbit hole? Here’s what we’ve got for you:
- eBook: LMS 101: Learning Analytics
- eBook: The Practical Guide to Evaluating Your Workplace Learning Effectiveness
-
Webinar: How To Utilize Data To Improve Operational and Learning Effectiveness
- Webinar: Top 5 Tips for Keeping Reporting Simple
- Article: What Are The Most Important KPIs for LMS eLearning?
- Article: The most beneficial metrics for eLearning and why you should track them
- Article: Healthcare Analytics: Why Educators Are Using Blended Learning and Big Data in Healthcare
- Article: Learning Analytics: The Art and Science of Using Data in eLearning
