


Here, we look at how learning analytics lets you track, report on, and increase learner engagement, including examples of some specific reports. For the full rundown, watch our webinar: Measure and Improve Course Engagement With Zoola Analytics.
Why You Need to be Tracking Learner Engagement
It’s not hard to convince those in the eLearning industry that an engaged learner = a learner more likely to achieve desired outcomes. But if creating engaging content is the goal, then at least part of the L&D process needs to be measuring and tracking how engaging past content has been.
The best way to do this is by using learning analytics.
Analytics platforms such as Lambda Analytics "Zoola" offer advanced reporting on metrics that speak to learner engagement—things like time spent learning, progress, feedback, and assessment breakdowns—all of which can be used to compare courses and content. Data analysis lets you understand the story of engagement within your program, which gives you the information you need to create the next chapter.
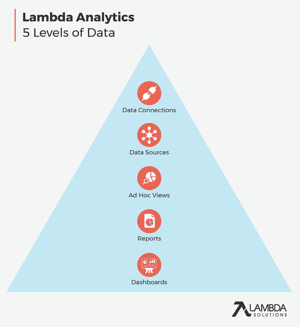 To tell that story, Lambda Analytics organizes learning data in a 5 level hierarchy.
Everything starts with a Data Connection—the connection between Lambda Analytics and your database. Built on top of that are Data Sources. These are designed as a way of further organizing information and making it intelligible. (Data Sources are pre-provided in Lambda Analytics, with a whole bunch ready to be used straight out of the box.)
eLearning teams use data sources as the ingredients to create Ad Hoc Views. This is the drag and drop designer, which facilitates data exploration and insight discovery. Once a data story emerges, it can be finalized and shared in two forms: Reports and Dashboards.
Advanced reporting requires making use of all the data sources that feed into your data platform. In Lambda Analytics, information on feedback, course views, and time spent learning can be found in the following data sources:
- Starter data source. This source includes data on time and feedback.
- Course dedication. Including time spent learning by course and activity.
- Feedback. Quantitative and qualitative information on the user perspective.
- Log table (full and light). A more comprehensive look at data over a longer time (light is restricted to a twelve-month period).
So How Exactly Do I Track Learner Engagement? (Reporting Strategies)
The key to benefiting from all these data sources is to use Ad Hoc Views. In this format, L&D teams can put data together in ways that express the reality of learner interactions, and then develop reports on engagement. Below, you’ll find examples of some of our most popular learning analytics reports used for tracking engagement and measuring course success:
 For Businesses
1. Annual Compliance Training
These reports let you see where your compliance requirements are being met efficiently in your organization, and where improvement is needed. Compliance Training reports give you the insights to make informed decisions regarding resource allocation, risk management, and future planning. These reports can also provide peace of mind for your stakeholders and clients, giving you a way to prove your regulatory adherence to investors and partners.
2. Training Assessment Results
You can learn a lot about the quality of your training programs from your quizzes and tests, and this report lets you do just that. Perfect for investigating if there is a correlation between Test Completion Time and Test Results, so that you can address underperforming courses or departments with targeted data-backed insights.
3. Training Assessment Breakdown
An assessment completion breakdown report will help you to see the performance results of all assessments, quizzes, and questions—including the number of attempts and grade statistics. This report helps to find out how engaging individual quizzes and questions are by aiding comparisons within or between assessments. Filterable by quiz, question and quiz start date.
It may seem hard to believe, but the truth is that testing your tests is incredibly important and most organizations do it wrong!
READ: See exactly where assessing assessments goes off the rails in this eBook on How Training Program Evaluation Is Hurting Your Talent Development.
For Educators and Academics
1. Time Spent Learning In Courses/Activities
Using the Course Dedication data source, this report lets you filter by course and user to reveal an engagement pattern for individuals, which can be helpful in performance reviews. Or, use this report to build a table comparing time-spent learning across courses, to find out the most popular, most demanding, and least used content.
|
Even before you begin building engagement reports, Lambda Analytics is tracking time-spent metrics—both for Time on Course and Time on Activity. As users go into courses and activities, the duration of their interaction is recorded, ending when users leave. All of that information is then captured (in seconds format) in the database and aggregated by time and day, ready for analysis. |
2. Progress: Activity Completion Status Summary
A progress report lists users, enrollment status, and completion dates, allowing you to see which activities gain the best user responses. This report includes information on user, course, dates and grades, and works well in Instructor Dashboards to help educators monitor class engagement. Filterable by course.
Looking for more on analytics reports? Try this webinar—Top 5 Tips for Keeping Reporting Simple.
3. Feedback Summary
A feedback summary collects all user feedback data across modules, letting admins to see the big picture in terms of user satisfaction. Use the Feedback data source to see how users rate your content. An effective way of interpreting those ratings in an engagement context is to filter out text fields and focus on user satisfaction scores. Create a cross tab or table to work out maximum, minimum, and average scores for different time periods.
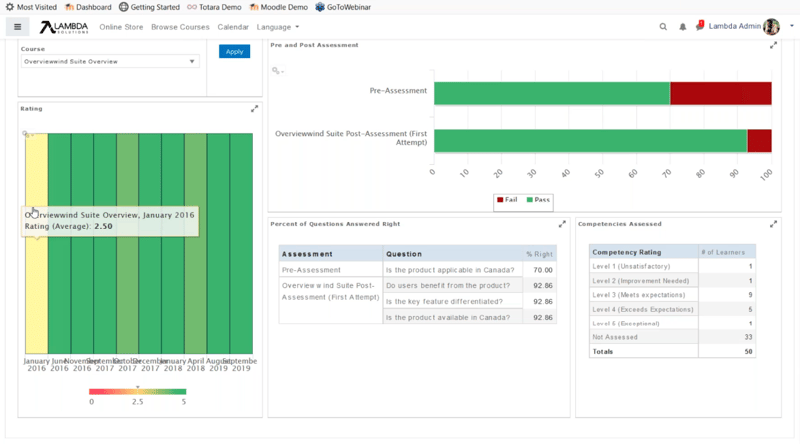
4. Quiz Question Pass Fail Statistics
Running this report will help you see the data on all quizzes, questions, attempts and grades. Seeing how grades and attempts change over time helps suggest which quizzes are most engaging. Filterable by quiz, question and quiz start date.
And when you start seeing a trend that might be pointing to a problem with the test - not the learners - Learning analytics can show you exactly how to tell if your quizzes are passing the grade.
|
Let your users know about all your advanced reporting with visualization plugins. For example, the Course Time Tracker appears as a box on course pages, to show users how long they’ve been working on a particular course. When enabled, Timer Interrupts require users to confirm their presence after a set period of inactivity. Once they’ve confirmed they’re back, the timer restarts. |
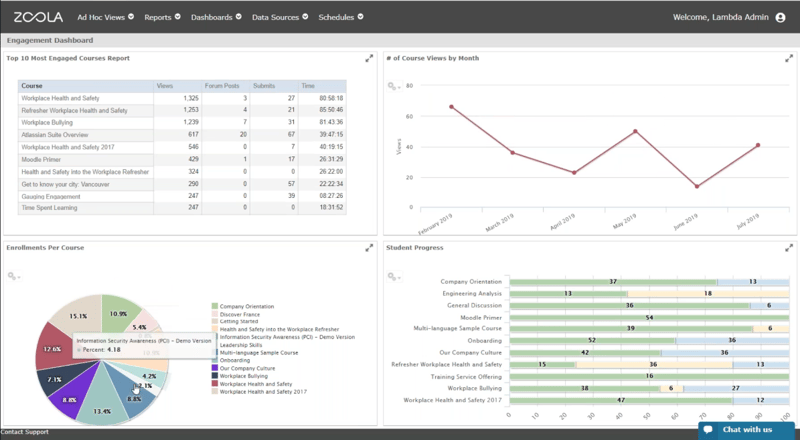
An example engagement dashboard. Combine multiple data points to give instructors and stakeholders a picture of learner engagement over time (Source: Lambda Solutions).
Next Steps—Using Reports to Improve Engagement
Visualize
When Ad Hoc reports reveal an engagement insight, it’s time to make that data visual. Showing your insights in a visual form is the easiest way to translate information for a general audience. For example, heat maps are great for showing instructors, managers—and others who are not hands-on with the data—which courses or activities attract the most interactions. This kind of clear evidence encourages those responsible to think about key take-aways from the best performing content.
For more ideas on how to harness engagement insights, watch this on-demand webinar on How To Use Interaction To Drive Engagement And Learning Outcomes.
An engagement dashboard is an effective method of updating a team with helpful information. Compiling data sources on engagement KPIs such as views, forum posts, and submissions (see above) can produce live tables, like the ten-most engaged courses or enrollments by course. Again, this acts as both an insight and incentive. Those who are not on the dashboard can learn from those who are, and work towards it.
Automate
Getting the information you’ve learned out to the people that need to hear it is easier when you automate things. Most good learning analytics platforms will let you schedule and share analytics reports—as well as embed dashboards into other communications—so that instructors and the people with the power to action your insights are regularly updated.
Automating LMS reporting over time gives you a way of seeing how engagement is changing from a top-down perspective. What was once your most engaging content may lose interest over time—reports at frequent intervals allow you to keep up with what your learners are interested in right now.
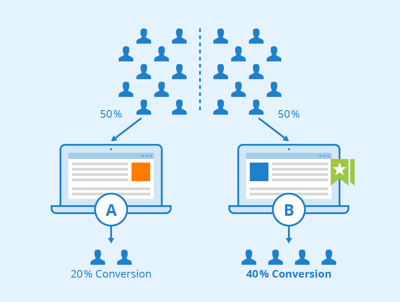
Once data analytics have identified an area of focus, split testing can help to find the most engaging solution (Source: Seobility, CC BY-SA 4.0).
Split (A/B) Test
Split testing is a strategy used across industries and roles, from user-experience designers to advertising executives. The approach involves splitting users into two or more groups and trying out variations on a design, piece of content, or another element to measure which option is the most engaging.
For an A/B test to be an effective indicator of possible improvements, it’s best to only test one element of your course at a time. Testing multiple variables can still suggest which versions of an activity are the most engaging, but the test won’t reveal what is causing an increase in engagement.
As this article on split testing for eLearning suggests, self-selection is a way of ensuring all users have an opportunity to access the most engaging eLearning content. This involves presenting learners with both A and B options, and having them give feedback on their preferences. Some ideas for split tests to measure and increase learner engagement might include:
- Testing two options for content formatting—paragraphs versus bullet points, monochrome versus colourful, etc.
- Comparing assessment performance after an interactive module versus a written-and-read module.
- Learning from student feedback after giving users the choice between independent and group-based activities.
Looking for more? This webinar goes into even more depth on how to Measure and Improve Course Engagement With Zoola Analytics (aka Lambda Analytics).
Data-led training is the future of efficient, cost-effective course design. If your organization is struggling to use data effectively, this Ask Me Anything (about) Zoola Analytics has the answers to the most common and persistent Learning Analytics challenges, answered by Zoola mastermind and Lambda Solutions’ VP of Products, Stewart Rogers.
Still looking for an answer to your data analytics question? Ask Our eLearning experts ANYTHING!

Ready to keep climbing down the Learning Analytics rabbit hole? Here’s what we’ve got for you:
- eBook: LMS 101: Learning Analytics
- eBook: The Practical Guide to Evaluating Your Workplace Learning Effectiveness
- Webinar: How To Utilize Data To Improve Operational and Learning Effectiveness
- Webinar: Top 5 Tips for Keeping Reporting Simple
- Article: What Are The Most Important KPIs for LMS eLearning?
- Article: The Most Beneficial metrics for eLearning and Why You Should Track Them
- Article: Healthcare Analytics: Why Educators Are Using Blended Learning and Big Data in Healthcare
- Article: Learning Analytics: The Art and Science of Using Data in eLearning
- Article: Analytics Reporting: How to tell if your quizzes are passing the grade
- Article: The Essential Guide to Learning Analytics in the Age of Big Data
