
How learning analytics contribute to understanding training ROI

For some of us, it's always gardening season. At my house, we’re either planning our garden, planting, weeding, or harvesting – depending on the season. Then we start planning again, using what we learned to do things better, keeping track of what we change from year to year to avoid past mistakes.
When the snow falls, we start thinking about spring, selecting seeds, researching companion planting for better yield, and shopping for planet-friendly solutions to chemical pesticides and fertilizers for the next growing season. Then it's time to start the seedlings, giving them their best chance to grow into hardly little plants that will survive and thrive over the growing season.
Once the ground is sufficiently unthawed (I live in the Great White North of Canada), the planting begins – putting all that new knowledge from last year into action. We make notes during summer to see which of our theories produced the best results, the hardiest plants, and the higher yields. Harvest and canning time soon follows, and then it's back to planning next year while we enjoy the fruits and vegetables of our labor.
Your learning analytics are shaped through cycles
Learning analytics are kind of like that. Data from our LMS systems provides us with the yield metrics derived from the rich soil of our content and the changing behavior of our learners – the seeds we sow that we want to see bloom and grow into the best version of themselves. The data we get is the raw organic material that we analyze to determine the next course of action for our training initiatives.
By understanding their metrics, companies like yours can make better decisions about their training investments and learn which areas need improvement. Some areas of your program may need more fertilizer (think learning culture, team buy-in, and learner engagement). Some may need more sunlight to illuminate the content that needs updating or replacing. Your seeds may need different courses as they move through their career – matching the right learner to the right course at the right time is kind of like companion planting (think onboarding, upskilling and reskilling).
In this article, we will explore how learning analytics contribute to understanding learner performance, program performance, and training ROI.
Analyzing return on your training investment – ROI and ROTI
Learning analytics have become an increasingly important part of the training landscape, allowing learning and development managers to better understand their ROTI - their return on training investment. Simply put, learning analytics is the process of collecting, analyzing, and interpreting your data to gain insights into how your learners engage with their assigned training materials and programs. By analyzing learning data, you can understand the impact your training has had on the knowledge and skills of your employees. I’ve written a post called “How do I calculate the ROI and ROTI of my online training?” that you might find helpful.
Use your learning analytics to make data-driven business decisions
The data, combined with human observation and input, will help you make informed decisions about where money should be allocated and what types of content should be offered in future training. You’ll want to keep doing what works, do more of what is working well, and upgrade any courses that are underperforming when it comes to delivering measurable results in employee retention and behavior change. Your seeds deserve the best soil you can provide them to help them thrive.
An informed allocation of resources can mean that resources go to course creation and maintenance that keeps course material current. You may need to bring on or promote additional training administrators when your garden, I mean, your user count grows. You may need to devote more supervisory cycles to helping select the right training to help individual learners to improve their productivity or get promoted. When you add user feedback as data, you may discover knowledge gaps that need to be filled with more courses or updates to courses already offered. And you may need the corporate culture equivalent of a scarecrow to help your company remove all the distractions that threaten your learning environment.
Learning analytics also provide insight into cost-effectiveness – do courses offer enough value relative to the cost of your program? Do you get enough “out” of the experience where it counts – whether reducing employee churn or increasing your sales numbers, or reducing the number of workplace safety incidents?
However, gathering learning metrics that demonstrate change requires patience
You’ve heard the story of the man who was growing a field of carrots and was impatient for them to grow so he could eat them. Every morning he would go out and pull one carrot out of the ground, look at it with disappointment and say, “Nope, not ready yet.” By the time the carrots were mature enough to eat, he had wasted over half his crop with his impatience.
Getting enough good data for accurate analysis requires patience and time. Learning doesn’t happen immediately; results take time to show up in human behavior. Make sure you give your training enough time to put down roots and flourish as a vital part of your corporate culture. Then, when the time is right – and only you can make that determination, you can take all factors related to your program cost, look at your expectations for change in test scores and learner behavior, and compare your actual results to gain valuable insight into your ROTI.
Do you need to allocate a budget for a more robust system or look for a more affordable alternative to the one you have if you aren’t using all the features you are paying for? Do you need to assign resources to create new courses or update the existing ones to achieve your desired results? Do you need to coach your managers on how to support a culture of continuous learning? Do you need to modernize or gamify your current curriculum to meet both learner expectations and today’s digital standards?
Learning analytics reveal LMS platform improvement opportunities
Did you know that you can help make online training better for everyone? It’s true. This involves building a strong two-way relationship with your vendor (assuming they want to know how happy you are with their software). In addition to helping your business understand ROTI through your learning analytics, your data can also be used by your LMS provider when creating new features or making changes within their existing products.
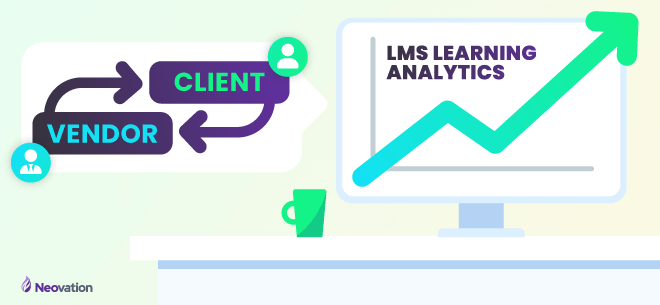
This feedback loop between customers and vendors allows LMS providers to understand customer needs and tailor better solutions accordingly, improving user and learner experience, increasing engagement, and ultimately leading to higher conversions from potential customers while improving service to their existing customer base. For example, here at Neovation, around 90% of our feature improvements come from client suggestions. We value this feedback like it is pure gold because it helps us make our platforms better for everyone.
Learning analytics and employee performance
Collecting data from learning analytics allows you to easily access information about your employees’ performance over time without needing as much manual input from their managers or trainers. It can remove or reduce perceptual or personal bias in employee evaluations – because subjective opinion can creep into the conversation. Statistics on engagement, completion rates, and knowledge retention can provide empirical proof as to how an employee is actually doing – not just taking their word or their supervisor’s word that they are succeeding or failing, as the case may be.
This type of analysis allows employers to quickly compare different team members’ performances and make adjustments accordingly if needed. It becomes easy to look at cohorts of learners – measure their performance, and see where change is needed. A good LMS will allow you to group your learners by role, title, responsibilities, tenure, and other demographics like geography. For multi-national companies or companies with a distributed workforce, this kind of evaluation is especially helpful for teams that span multiple locations or countries where direct communication isn’t always possible. You can see how all the salespeople in Boston are doing or how all the salespeople with more than five years of experience are doing nationwide, for example.
Monitoring learner engagement rates
One way that learning analytics contribute to understanding training ROI is by measuring engagement rates. Through tracking interactions such as page views, average login frequency, and course completion times, providers can begin to understand how users are engaging with a given course or program. For example, if a company has invested in an online course, but users are only logging in for 5 minutes each session or completing less than half of the course content, then it may be time for a review of the content quality or structure.
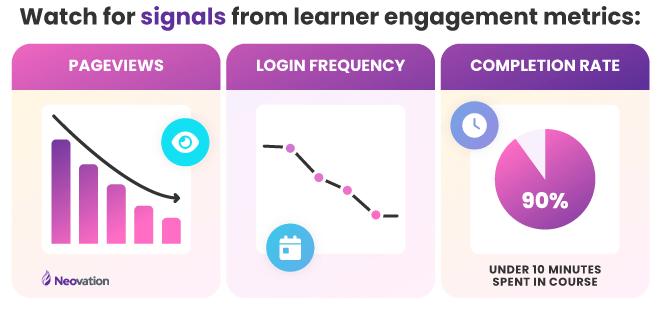
On the other hand, if the same course is being completed by 90% of users in under 10 minutes per session or above-average completion rates are seen across several courses, then that could signal that the investment is paying off – or that the course is too easy and needs to be updated or upgraded. No data stands in isolation – so look to other metrics to corroborate and ratify your decisions.
Measuring learner outcomes
Another key metric is learner outcomes – did learners actually learn what they were taught? Analyzing test scores from assessments can help trainers measure how successful their courses were at transferring knowledge to their learners and how much knowledge is retained over time. If a significant portion of learners fail tests regularly, then it could signal that either more rigorous assessment criteria need to be set up (e.g., higher thresholds for passing scores) or that changes need to be made to improve overall course quality so that learner outcomes match expectations more closely. If everyone fails the same question, the fault lies in the question, not the entire cohort of learners. The question may need to be rewritten, or multiple choice answers reviewed for ambiguity. Maybe the concept wasn’t adequately addressed in the course material. You’ll have to dig in to find out.
The true test of learner outcomes is changed behavior over time. That may not be something your LMS analytics suite can tell you, but other KPIs in your company can be analyzed in parallel to your training data. These KPIs will vary based on your business model and training objectives. Some more common long-term measurables are reduced workplace accidents, improved punctuality/reduced absenteeism, higher productivity, increased sales per linear foot or labor hour, increased “basket size” of purchases, or more staff qualified for advancement.
If you are in an industry that delivers compliance-based training that must meet external standards for certification or licensing purposes, then higher compliance test scores or more employees meeting compliance standards are the metrics to watch for.
How to approach your training data
Learning analytics, like my garden notes, can provide valuable insights into your training operations and help ensure that investments are yielding tangible results. By understanding ROTI through analytics, we are able to adjust our strategy as needed while still receiving maximum benefit from our LMS provider's offerings. Ultimately, this kind of analysis ensures that your business gets the most out of your investments in employee development while still providing a great user experience through your Learning Management System.
We’ve talked about the importance of understanding how your existing training programs are performing before you can begin properly allocating resources and making decisions to implement or improve your online training program. Learning analytics provide insight into how users are engaging with your content, what areas require more attention, if there are any user trends in terms of engagement or activity levels, and ultimately if your investment into the system is resulting in positive outcomes and returns – or not. The ability to measure the ROI of a training program using learning analytics allows you to determine where you should focus future investments, as well as decide whether or not certain elements of a program need to be modified or changed altogether.
Here’s how.
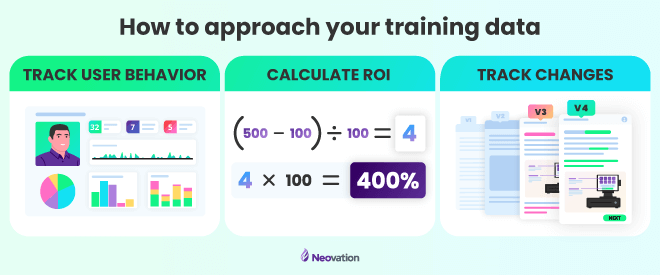
Step One – tracking user behavior
The first step in understanding ROTI from learning analytics begins with tracking user behavior throughout a course or series of courses within your LMS. This includes tracking activities such as registration rates, dropout rates, time spent on each page/activity, number of attempts at quizzes/tests/activities, and performance on such tasks. Taking this data into account provides insight into how effectively users are engaging with content when taking a course. Additionally, this data can help identify areas where users struggle the most – which may indicate potential modifications needed within a course to increase engagement levels.
Step Two – calculating ROTI
Once your data has been collected over a sufficient period of time – perhaps as long as a year, it is possible to begin calculating ROTI by analyzing how much time was saved due to an effective training plan versus how much money was invested in its creation and implementation. For example, if an organization spends $100 on creating an online course but saves $500 through improved efficiency due to improved employee competency after learners take the course, then the ROTI would be 400%.
Step Three – keeping track of what you change
The analyze/revise/review cycle is never completed. You do it over and over again. It is important that organizations track changes made over time when assessing ROTI through learning analytics – such as increased user engagement after modifying certain aspects within a course – as this highlights actual impacts such changes have had upon overall employee performance levels related directly back towards ROTI calculations for said training program(s). This also reinforces any decisions about future investments when deciding whether or not changes should be made to improve overall returns from said system(s).
Harvesting the results of understanding your learning analytics
Overall, understanding ROTI from learning analytics provides organizations like yours with key insights about your investment in online training programs for your employees. You’ll gain insights into
- Seeds – user behavior patterns throughout their courses and in the workplace
- Weeds – potential issues with current content or design structures within courses based upon user feedback/performance metrics, and
- Yield – calculating overall returns from your investment.
A good gardener knows their landscape. Similarly, you need to consider all your digital and analog data points when measuring results against your initial training objectives. Who knows – your objectives may have been misaligned with your KPIs – and you get to fix that before the situation becomes critical. Beware of vanity metrics that want to stand alone and make you feel good but don’t demonstrate changes in user behavior. Those metrics are like a garden full of flowers – pretty to look at, but they won’t feed you.
With such powerful information at hand, your organization can make informed decisions based on real-world results rather than just assumptions. You’ll be able to more effectively deploy your resources to course correct as needed while still achieving the maximum return on investment possible. Learning analytics are the most important tool in your garden shed when it comes to harvesting great results from your eLearning ecosystem. Here’s to a bountiful harvest of ROTI and achieved training objectives!


-svg.svg)
-svg.svg)
-svg.svg)
-svg.svg)