


There is no longer a one-size-fits-all approach to training programs in the dynamic learning environment of today. We need a mechanism to gauge the success of our learning activities to make sure that knowledge is retained and skills are improved. The Learning Management System (LMS) report is a veritable gold mine of information that provides a glimpse into the efficacy of your training initiatives.
We'll examine important indicators, look at real-world uses, and teach you how to turn data into insights that can be put to use.
What Can LMS Reporting Really Tell You?
The process of creating and evaluating data inside a Learning Management System (LMS) to obtain an understanding of many facets of online learning and training programs is known as LMS reporting. Administrators, educators, and other stakeholders can monitor learner progress, evaluate the success of a course, and make data-driven decisions to enhance the learning process as a whole with the help of LMS reporting.
Here's a breakdown of key aspects of LMS reporting:
- Data Collection:
- The LMS gathers data on user activity, such as course completions, assessment scores, time spent on learning materials, and engagement levels.
- It may also track learner demographics, prior knowledge, and performance history.
- Data Analysis:
- The collected data is then analyzed to generate reports and dashboards.
- These reports can be customized based on specific needs, allowing for in-depth analysis of individual learner progress, team performance, or overall program effectiveness.
- Benefits of LMS Reporting:
- Track Learner Progress: Monitor individual and group progress through course completions, assessments, and completion rates.
- Identify Skill Gaps: Analyze areas where learners struggle and adjust training programs to address specific identified needs.
- Measure ROI (Return on Investment): Track the impact of training programs on employee performance, customer satisfaction, or other relevant metrics.
- Improve Engagement: Identify areas where learners may be disengaged and adapt your training approach to boost motivation.
- Make Informed Decisions: Support data-driven decision-making regarding future training initiatives and resource allocation.
- Individual Learner Reports: Track individual progress through a course, including time spent, assessments attempted and passed, and areas where they may need additional support.
- Course Completion Reports: Analyze the overall completion rate for a specific course and identify any significant deviations or trends.
- Learning Activity Reports: Track engagement with specific learning materials, such as videos, quizzes, or simulations.
Organizations can build and deliver impactful training programs that contribute to overall success by utilizing LMS reporting features.
Key Metrics for Powerful Learning
To evaluate the success and influence of educational activities, key performance indicators for powerful learning are crucial.
These metrics give educators and administrators insightful information on learner progress, engagement levels, and course results, empowering them to make well-informed decisions and maximize the learning process.
Stakeholders can pinpoint areas of strength and progress by monitoring important indicators like quiz performance, learner satisfaction scores, course completion rates, and time spent on learning activities.
Tracking Learners' Course Progress
Comprehending how your learners are advancing through your training courses is essential to guaranteeing their accomplishment and optimizing the efficacy of your training campaigns.
Learner progress reports, which include capabilities such as tracking completed, in-progress, and enrolled learners, provide insightful information about the learning process at different phases.
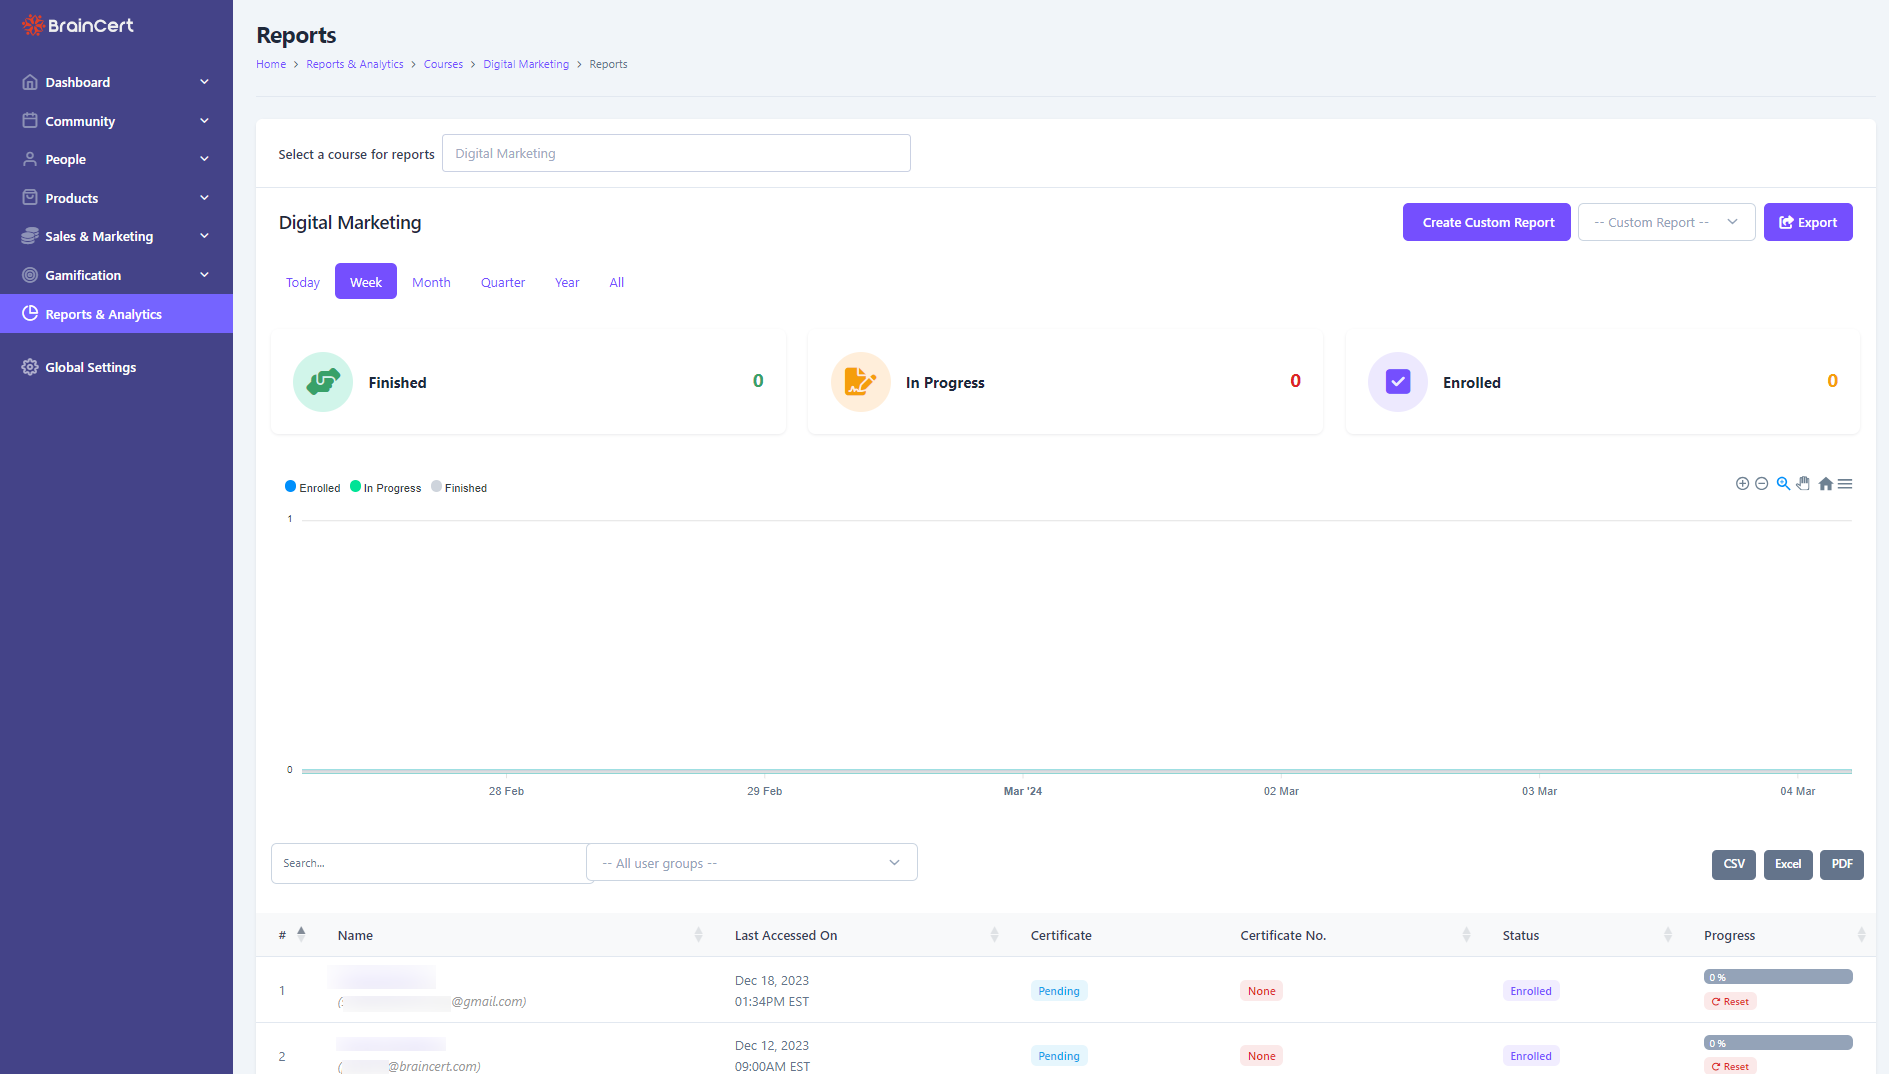
Tracking learner progress is crucial for several reasons:
- Tracking progress allows you to see if learners are actively participating.
- You can then identify and address issues that lead to disengagement, such as difficulty with the material or lack of motivation.
- Analyzing learner progress data helps you identify areas where your training program might be lacking.
- This allows you to revise content, adjust difficulty levels, or explore alternative training methods to maximize program effectiveness.
Tracking Learner Test Reports for Better Evaluation
Tracking test reports is essential for promoting continuous improvement, informing instructional decision-making, and ultimately enhancing the learning experience for all learners.
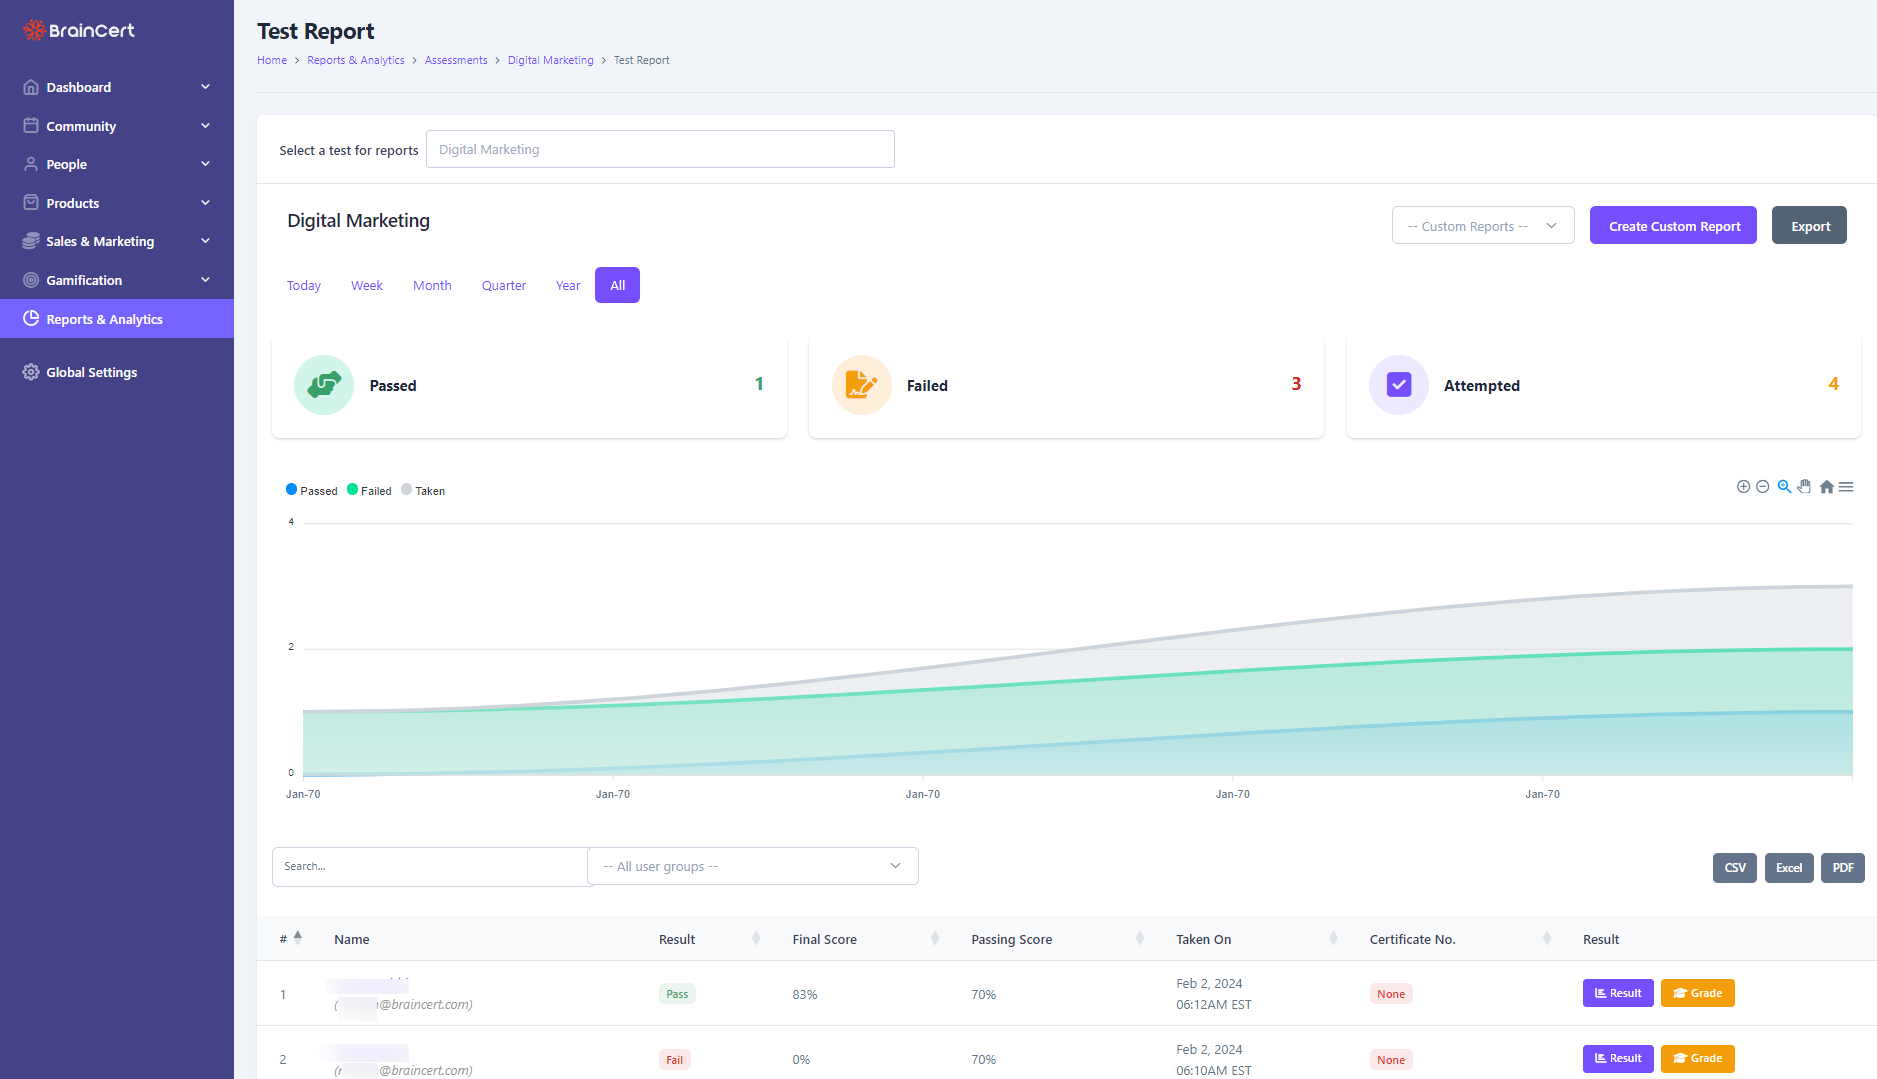
Tracking test reports is important for several reasons:
- Test reports help educators pinpoint areas of weakness or misunderstanding among learners.
- By analyzing test scores and performance trends, educators can identify common misconceptions or topics that require additional clarification or review.
- Test reports enable educators to track learners' progress over time.
- By comparing test scores from different assessments, educators can assess learners' growth and development and tailor instruction to meet their evolving needs.
Reports on Virtual Classrooms: Valuable insights
One of the most important tools for tracking and assessing the success of online courses is the virtual classroom report. It is a thorough tool for monitoring participants, their degrees of involvement, and the general effectiveness of online courses.
The virtual class report's main elements are keeping track of how long participants spend in the virtual classroom, noting when they enter and exit, and recording the kind of invitation each participant received and their attendance status.
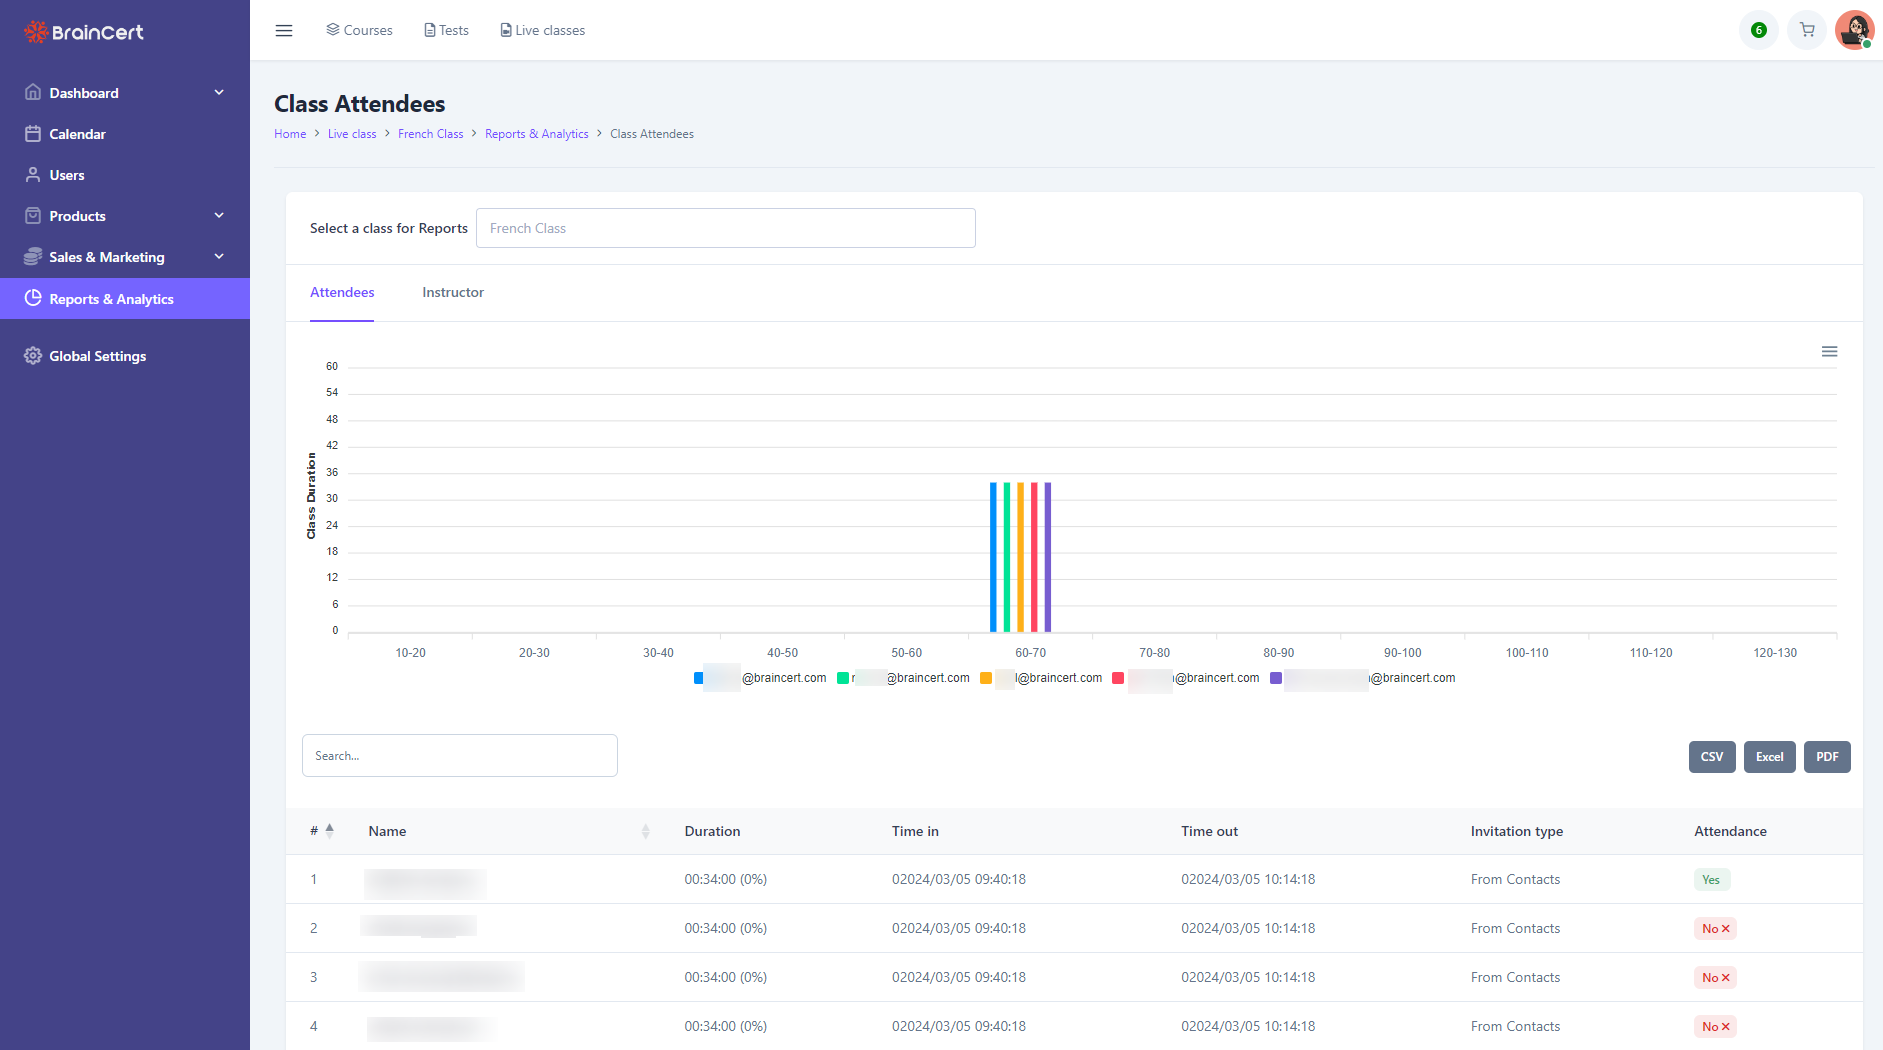
Tracking Attendance:
- Virtual classroom reports track login and logout times for each attendee, providing a clear picture of attendance duration.
- This can reveal engagement patterns, identify potential drop-off points, and inform decisions about session length or activity structure.
- Reports can differentiate between attendees who received a direct invitation (essential personnel) and those who opted-in (optional attendance).
- This helps gauge the interest levels in specific topics and can be used to tailor future sessions accordingly.
Making your Online Store Successful with Reports
Online retailers rely heavily on the Online Store Report to assess the effectiveness of their e-commerce platforms and make well-informed decisions that will increase sales and customer happiness.
The report includes several key performance indicators, such as the revenue, orders, conversion rate, average order value, product, and top customer graphs.
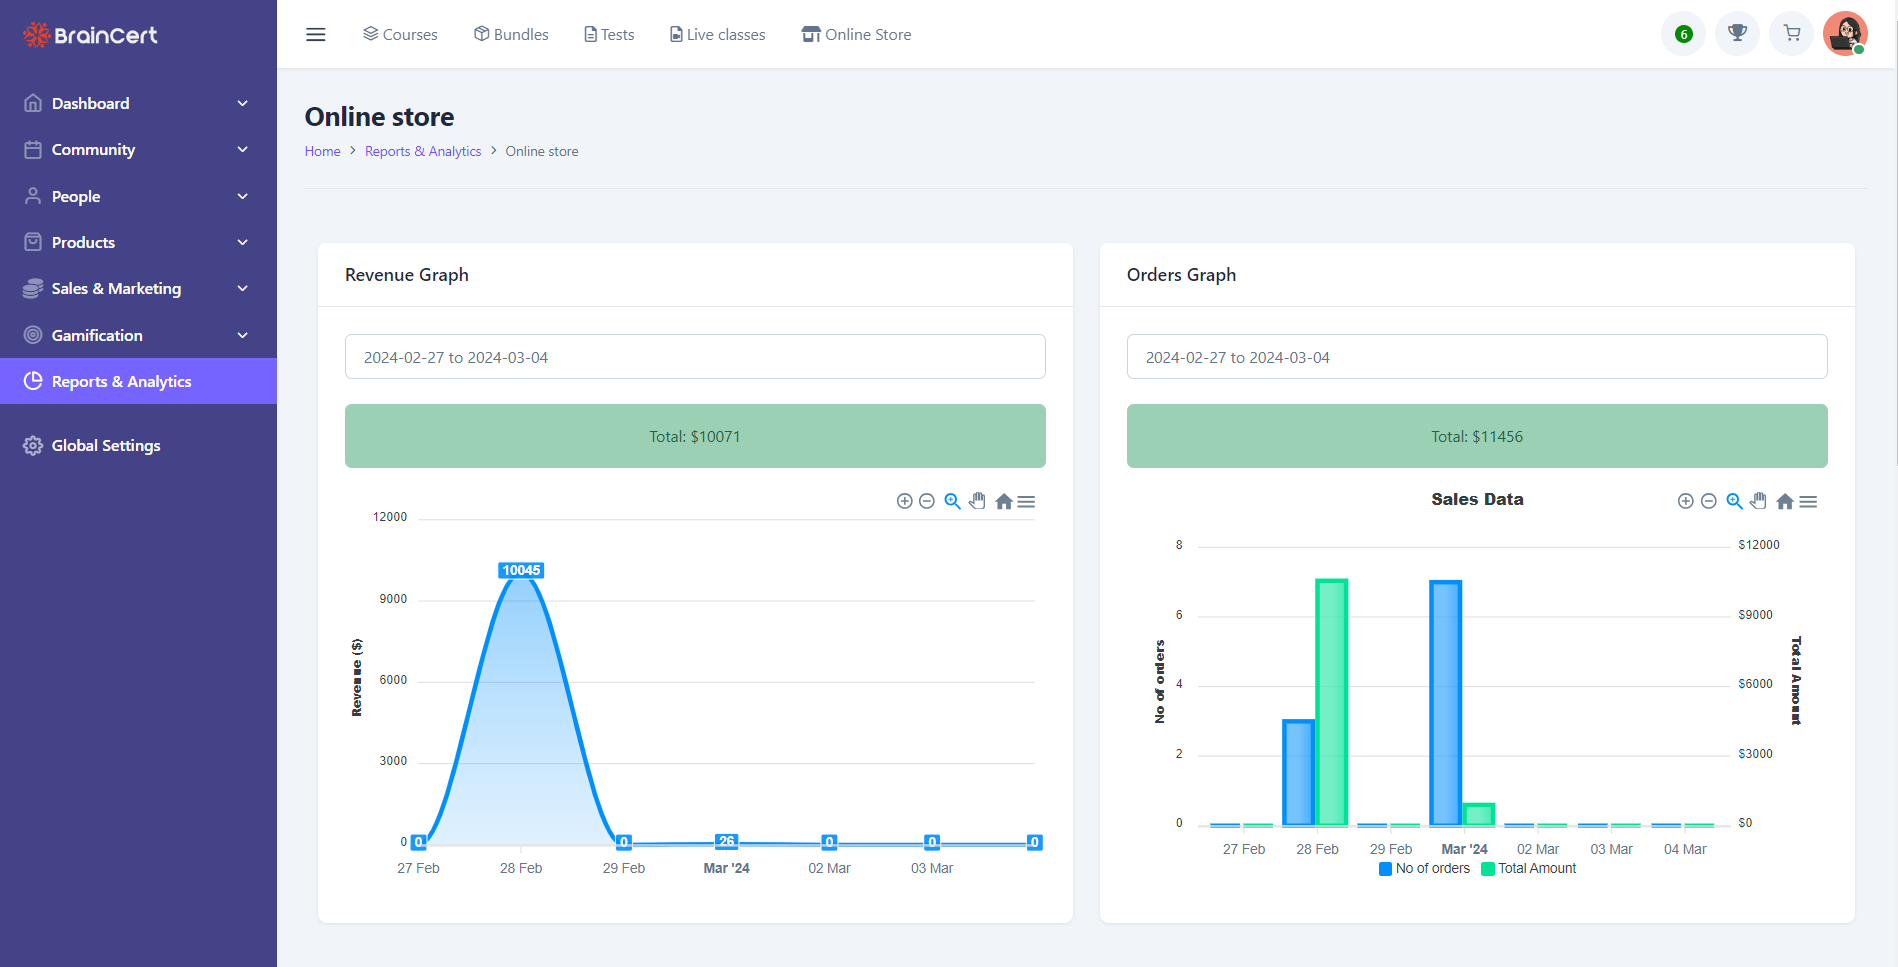
Enter the online store report, your all-in-one tool for understanding your business's health and unlocking its growth potential. Let's delve into the key metrics within an online store report and why they matter:
Financial Performance:
- This visual representation tracks your overall sales over a specific period.
- It allows you to identify trends, analyze seasonal fluctuations, and measure the success of marketing campaigns.
- This graph reveals the number of orders placed within a time frame.
- Analyzing it alongside the revenue graph can provide insights into your Average Order Value (AOV) and identify potential areas for improvement, like upselling or cross-selling strategies.
Conversion Optimization:
- This crucial metric indicates the percentage of visitors who complete a desired action, typically making a purchase.
- Analyzing your conversion rate helps you identify any bottlenecks in your sales funnel and optimize your website for a better user experience.
Why Course Assignment Reports Matter
Reports on course assignments are more than just requirements. They provide an essential insight into the growth, comprehension, and areas in which learners still need to improve.
Course assignment reports are essentially the link that connects instruction and learning, enabling educators to improve their methods and giving learners the tools they need to succeed.
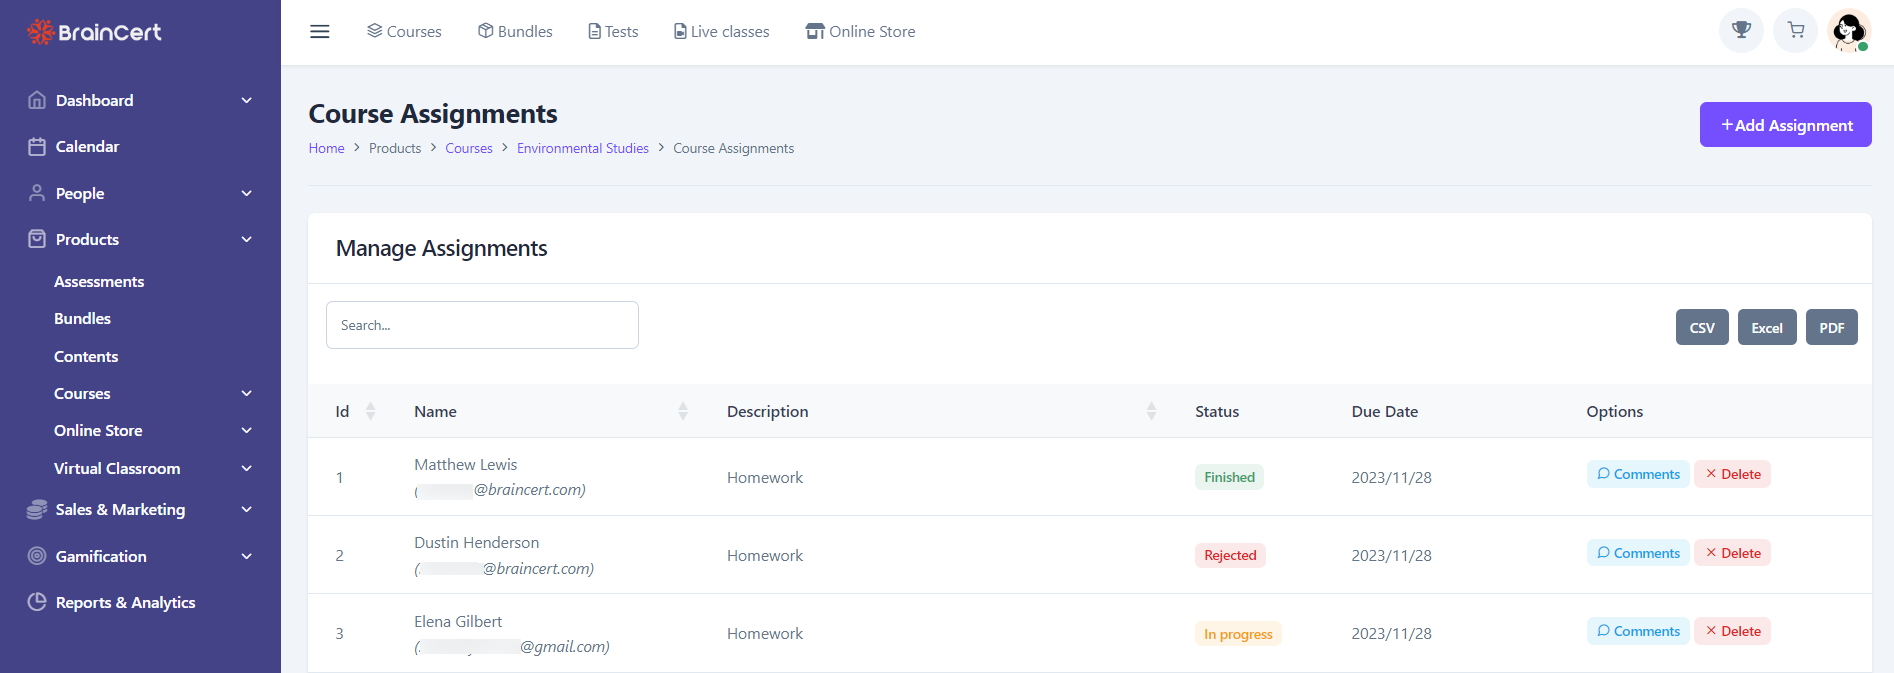
Here's why these reports are a secret weapon for educators:
- Unlike a single letter grade, assignment reports provide a real-time snapshot of where each student stands.
- "Finished" indicates a completed assignment, allowing you to assess their understanding through their work.
- "Rejected" highlights a missed opportunity for learning, potentially revealing a learner who ignored instructions or misunderstood the task.
- "In progress" signifies a learner actively engaged but needing more time or support to complete the assignment successfully.
- Assignment reports can be used for formative assessment, providing a continuous feedback loop throughout the learning process.
- You can identify areas of difficulty early on and adjust your teaching strategy or offer targeted feedback to help students master the material before summative assessments.
Why Answer Breakdown Reports Are Important
Training programs are designed to equip learners with the knowledge and skills they need to excel.
But how do you ensure your training is hitting the mark?
This is where answer breakdown comes in – a powerful tool often overlooked in Learning Management Systems (LMS) due to limitations in data transfer standards. Let's delve into why answer breakdowns are crucial and how BrainCert LMS offers a distinct advantage in this area.
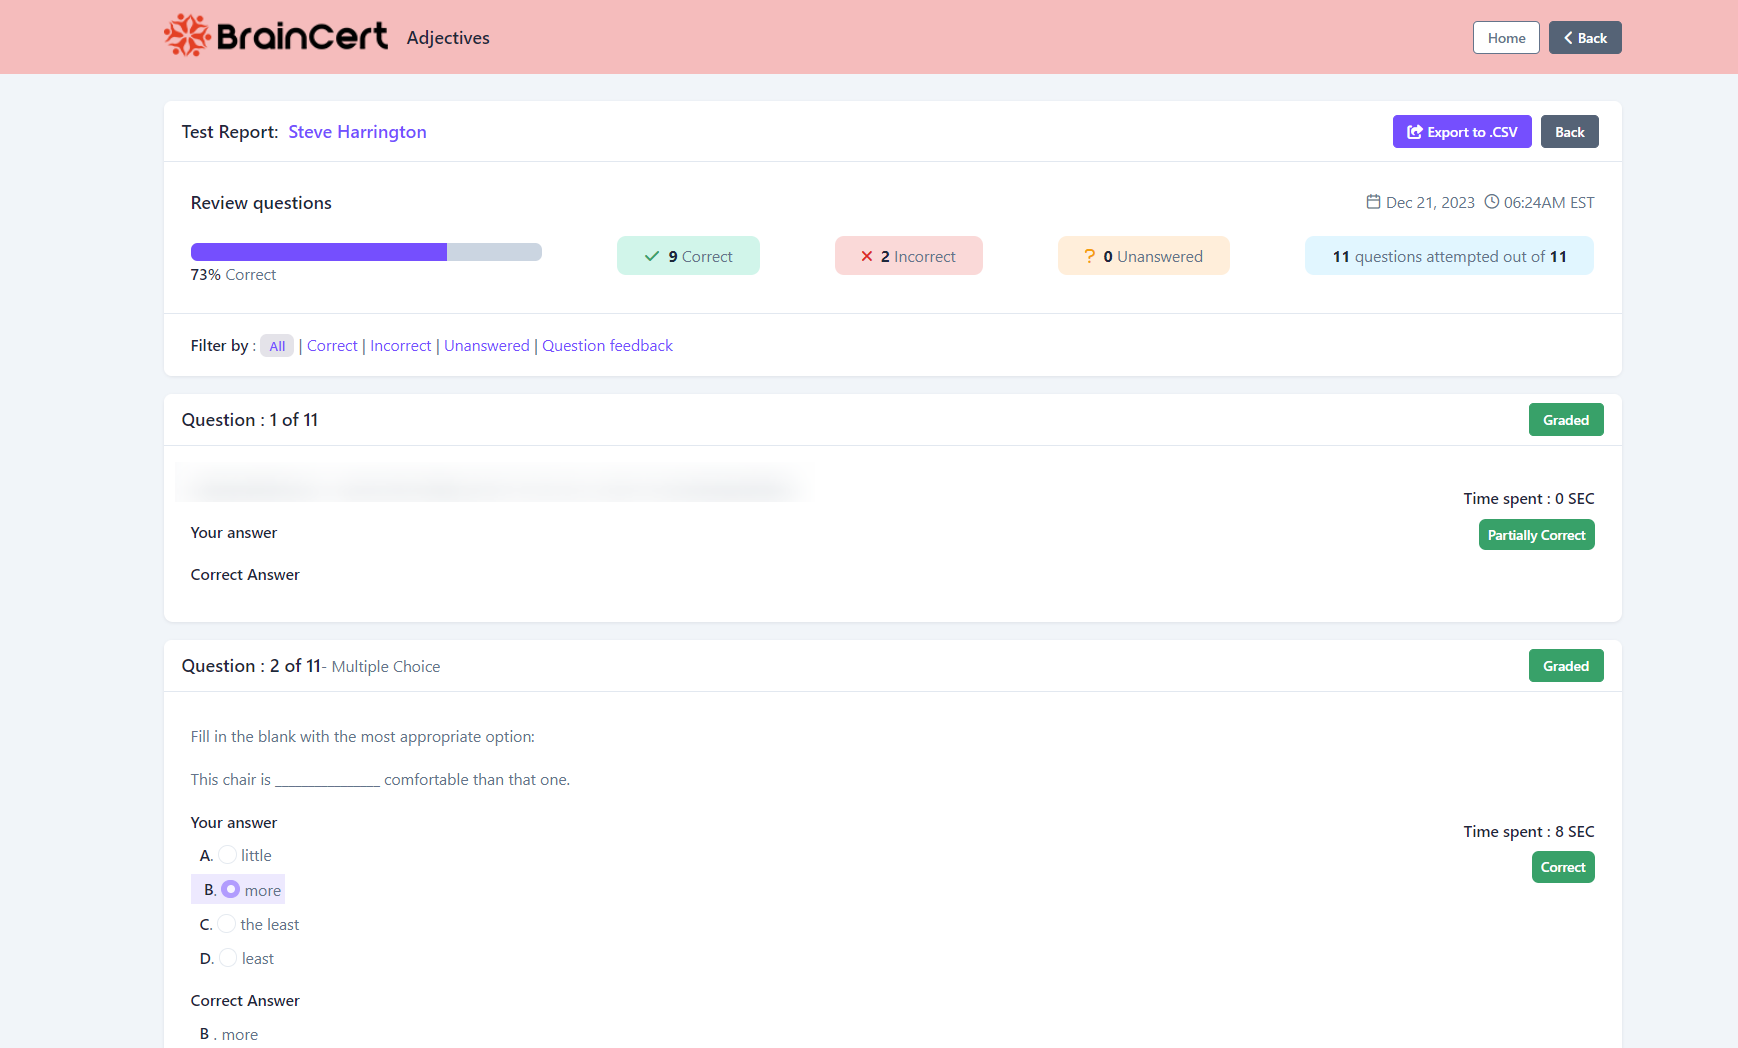
Traditional LMS reports might provide basic information like pass/fail rates in quizzes. But that only paints a partial picture. The answer breakdown goes a step further, revealing:
- Identify confusing questions or areas with repeated incorrect answers and adjust the learning materials to address these specific knowledge gaps.
- If learners struggle with specific answer choices, you can provide targeted support resources or revise explanations to improve clarity.
- Analyzing answer breakdowns can inform the design of future quizzes, ensuring they effectively assess learner understanding and identify potential blind spots in their knowledge.
A Look at Learner Performance from the Leaderboard
Traditional training can sometimes feel like a slog – static content, dry delivery, and a lack of motivation.
But what if learning could be fun, engaging, and even a little competitive?
Gamification and leaderboards step in, revolutionizing the learning process and memory retention techniques.
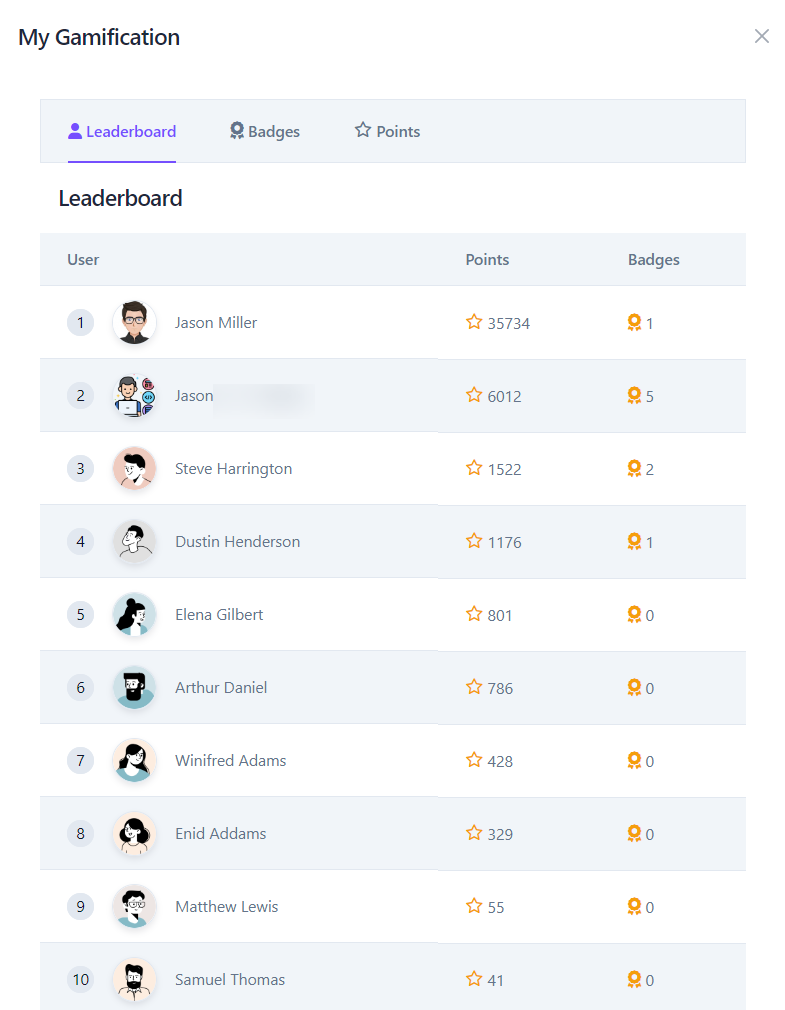
Leaderboards display learners' progress in a visual ranking, fostering a healthy dose of competition. This can:
- The desire to climb the leaderboard and outperform peers fuels learner motivation.
- They actively participate, strive for higher scores, and push themselves to master the material.
- Leaderboards act as a spotlight, revealing the individuals who are most dedicated to learning and skill development.
- This valuable insight can help you build a talent pipeline, identifying those with the potential for leadership roles or advanced training opportunities.
- Looking at the leaderboard allows learners to gauge their progress compared to their peers.
- This fosters a sense of community and motivates those who might be trailing to step up their efforts.
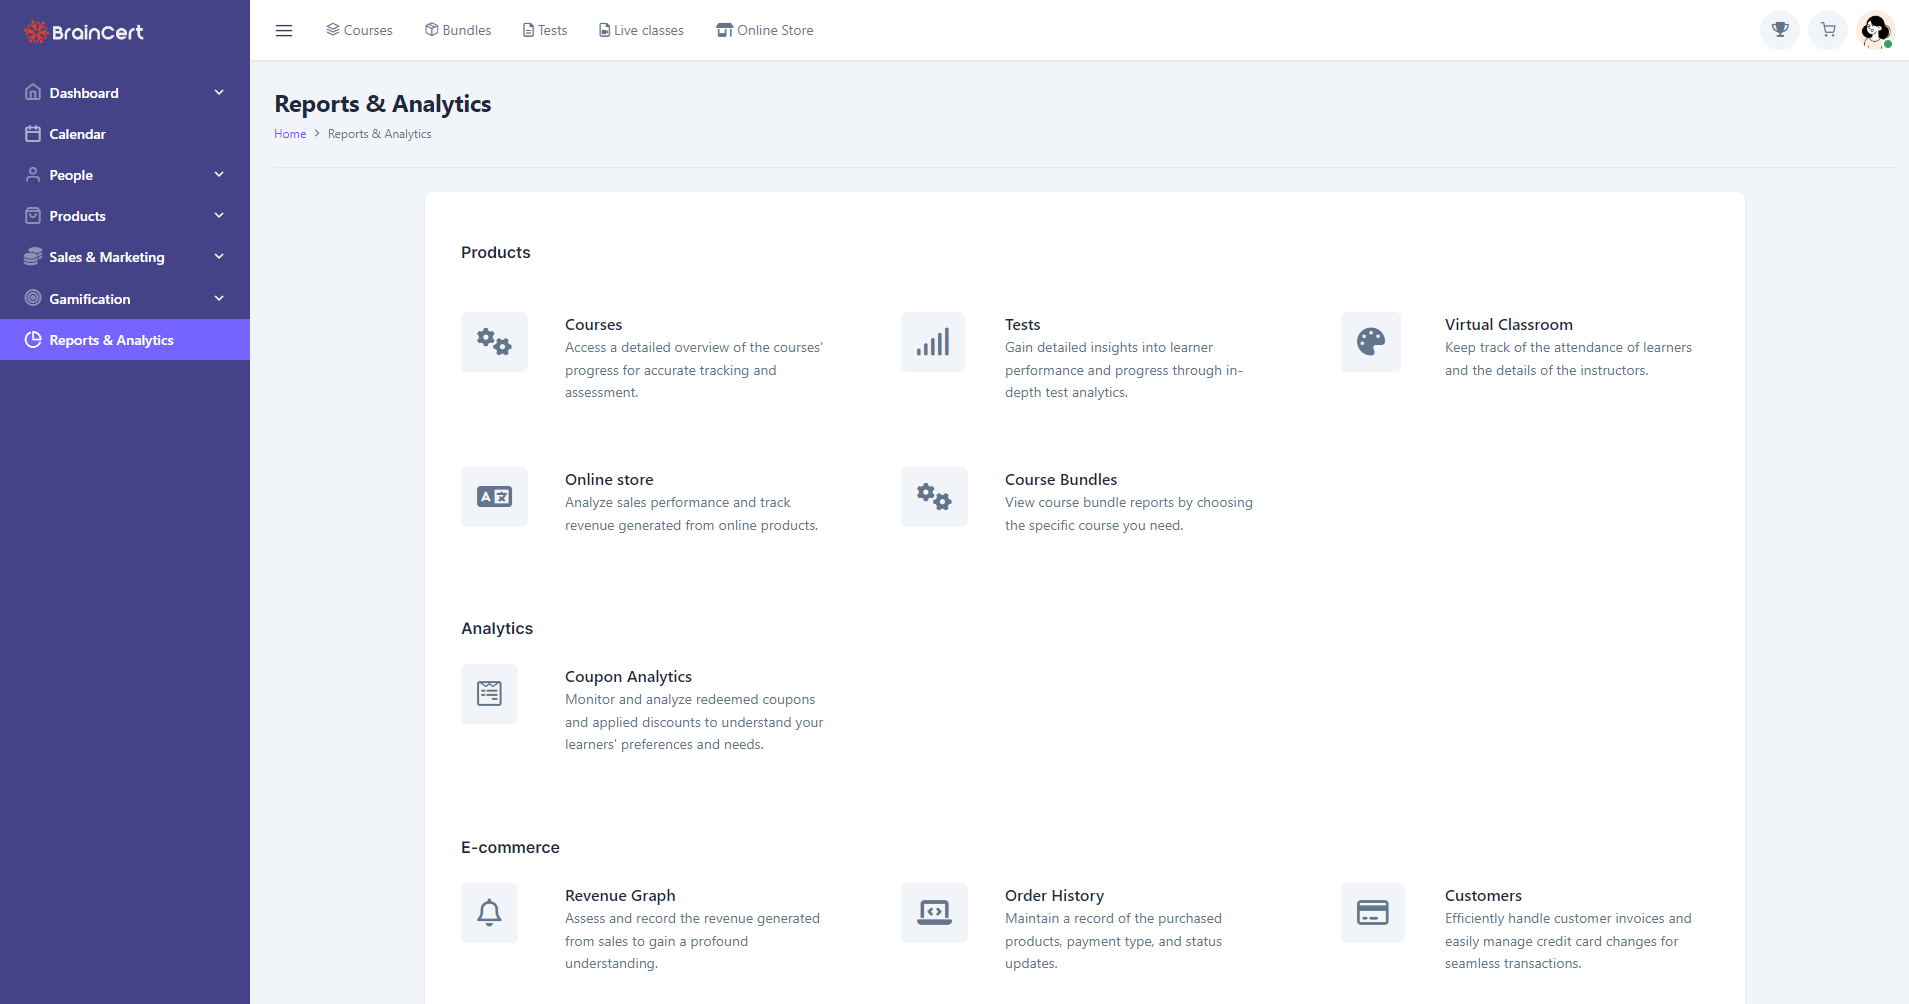
Reports & Analytics
BrainCert offers comprehensive reports and analytics for courses, tests, virtual classrooms, online stores, course bundles, coupons, revenue graphs, order history, and customer data.
These insights help users track learner engagement, monitor sales trends, analyze test scores, and optimize marketing strategies.
With these tools, users can make data-driven decisions to enhance learning experiences and drive business growth effectively.
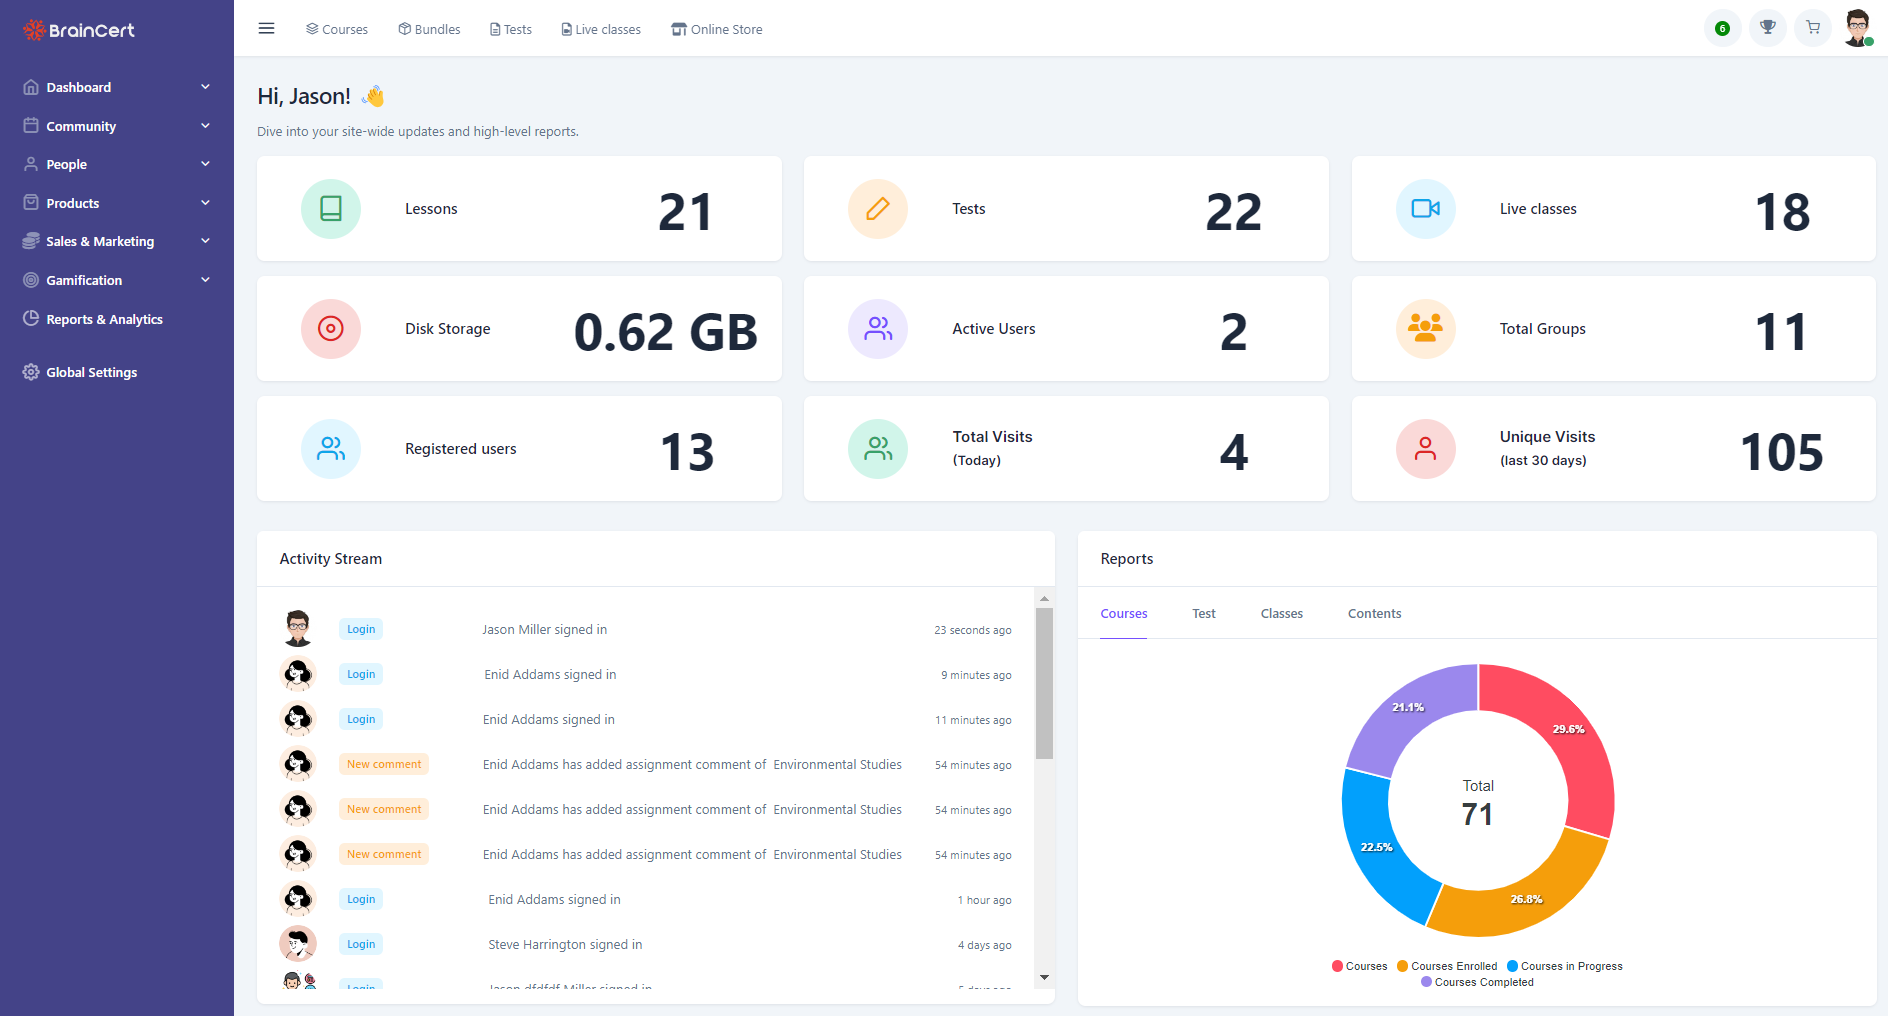
Dashboard
The dashboard serves as a gateway to every component of our eLearning platform, functioning as a personalized command center. Users can track their achievements and progress with enthusiasm and pride through this interface. It offers insights into badges, points, and a summary of completed courses, assessments, and live classes in progress.
Acting as a center of empowerment, it allows users to map out their educational journey and celebrate milestones along the way. With the dashboard easily accessible, users are well-prepared to traverse the eLearning terrain with confidence and enthusiasm.
To Conclude
Comprehending LMS reports is paramount for enhancing learning outcomes, and BrainCert stands as a beacon in this endeavor. Through meticulous analysis and strategic application of these insights, BrainCert empowers users to adapt instructional strategies, tailor learning experiences, and ultimately drive improved learning outcomes. With BrainCert as a trusted ally, educators can navigate the complex landscape of LMS reports with confidence, leading to more effective teaching practices and enriched educational experiences for learners.

