


- Blog
- How learning Bursts Support Attention and Memory
The Art of Incorporating Training Metrics
-
 Juel Iverson
-
 September 22, 2022
As a kid, do you remember an adult in your life making shapes with their hand, placing them behind a light, and casting a surprising shadow on the wall? I remember a barking dog and a simple bird with gentle flapping wings. There are artists that specialize in this kind of shadow art, such as Kumi Yamashita who carefully places everyday objects in front of a single light source to create striking silhouettes. (Please explore some of her amazing work at this link.)
I often use shadow art like this as a metaphor to illustrate the role Learning and Development plays in achieving business results and use of training metrics. In my view, as L&D professionals we are responsible for identifying the many separate, yet closely related, components of employee performance, and then must architect them all together in a web of interconnected training assets, performance support, and development opportunities to create cohesive learning ecosystem. It requires both nano-level attention to detail AND big picture thinking.

For artists like Kumi Yamashita, the final product is a clear silhouette of some kind, like a profile of a face, person, or animal. Her building blocks are small pieces of common household objects like wood blocks, magnets, and other seemingly ordinary objects. In learning and development, the end result should be a clearly defined and measurable performance result with clear training metrics, such as reducing turnover, increasing customer satisfaction, increasing sales, or something similar. Our building blocks are online and classroom training, rich media, immersive simulations, on-the-job performance support, and whatever other modality the learners need.
And it all starts with knowing exactly what you’re trying to achieve—what that final picture will depict. To do this here at AllenComm, we use our Performance Mapping framework, which guides us to meticulously establish and define the training metrics, learning measurement, and training evaluation strategies we are going to use before we begin designing any program.
Establishing the goals and training metrics are like the light source. The design of the curriculum are the things that cast the final shadows and achieve the effect we want on the end audience. To begin mapping all of the variables and how they fit together, we establish the following, in this order:
- Ultimate Business Impact: what specific KPI is going to change and how
- Behavioral Proficiency: what specific behaviors must we see learners do differently
- Learning Objectives: based on the behaviors we are changing, which learning objectives must we target
- Modalities and Sequence: finally, what specific learning modalities and in what sequence are best for learners
This process incorporates Kirkpatrick’s Four Levels of Learning Measurement, which has been the gold standard in the industry for many years. However, in our experience most L&D professionals only measure to the lower levels. In fact, in a recent webinar hosted by AllenComm, the vast majority of L&D practitioners report only measuring level 1, and maybe level 2. There are many reasons for this: limited technology and budget are two of the biggest. However, we believe designing your solution by establishing training metrics first regardless of the size and scale of the program makes achieving level 3 and 4 more obtainable.
A Case Study with Training Metrics
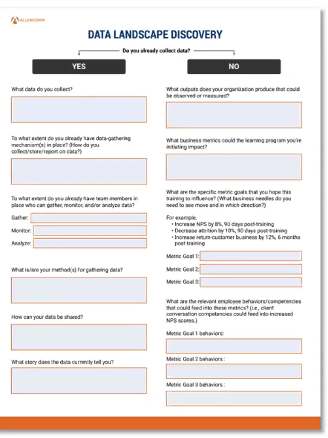
For example, we recently supported Delta Air Lines as they sought a re-design of their customer service center onboarding program. Together, we established the measurable goals that were desired of the business and completed a data landscape discovery process to determine how the solution we designed would ultimately be tracked and measured. We made sure to document both what performance results we wanted, and what data source would be used to measure the training effectiveness. Spoiler alert: it wasn’t easy and the data came from many places. Here are just a few examples of what this Measurement Strategy Plan looked like:
| Measurement Strategy Plan… | |
| Desired Measured Change | Metric of Measurement and Method of Measurement |
| Increase proficiency and productivity | Call Handling Time; measured through phone system |
| Increase in customer satisfaction | Specialist Promoter Score; measured through post-call customer performance survey |
| Increase speed to resolution | First-contact resolution; measured through phone system |
With this plan in hand, we then carefully curated existing content, and built new content to fill the gaps when needed. With our clearly defined goals we had a light shined in the specific direction we wanted to go, put all of the pieces into place, and launched the program with resounded success, including (but not limited to):
- 93% increase in Employee Net Promoter Score
- 207% increase in training capacity
- 15% increase in productivity
- 3% faster proficiency
We’ve seen similar results with many of our other clients, including those with curriculums in manufacturing, sales, and compliance.
We understand that training evaluation is difficult and that it depends greatly on technology. When there isn’t an easy, all-in-one tool to help manage the many variables of training, it’s easy to become disheartened. However, the end result—that big picture—is worth it. Using the steps we’ve outlined, you are able to carefully map out the curriculum and determine what and how can be measured. This detailed and cohesive approach enables more insights into training metrics and how to achieve (and measure) the ultimate impact your program has on the business.