 In a world that’s increasingly reliant on technology, the education and corporate learning sector is no exception. eLearning or online learning, has seen a dramatic rise in popularity (and effectiveness) in recent years. These 100+ eLearning statistics serve as powerful evidence of this trend.
This surge is driven by factors like flexibility, affordability, and the ability to cater to diverse learning needs. Let’s not beat around the bush, this is an undeniably effective approach.
For those of you who are evaluating digital learning solutions, you’ve come to the right place! We have gathered 100+ eLearning statistics that demonstrate the power of online learning and show what you can achieve with efficient learning technology solutions.
We’ve also reviewed these statistics to make sure they’re up to date and we’ve provided the most relevant source we can find. Please let us know if there’s any we’ve missed.
If these eLearning statistics don’t convince even the most reluctant leaders, we don’t know what will! Let’s get started…
eLearning Industry Statistics
The internet has gradually become more easily accessible all over the world. As a result, the eLearning market has seen impressive growth over the past 20 years. So, let’s take a look at the current online learning industry statistics!
1. By 2030, the eLearning market is forecasted to grow exponentially, reaching over $545.3 billion. The online learning industry is not showing any signs of slowing down!
2. eLearning is the quickest growing market in the education industry with a whopping 900% growth rate since 2000.
3. And mobile learning is one of the fastest-growing markets within the eLearning industry, with an annual growth of 23%.
4. The online learning platform market (including learning management systems) is seeing slower growth at 5.26% each year. It’s expected to reach $58.45 billion by the end of 2024.
5. In 1995, just 4% of corporations used online learning. Nowadays, 90% of organisations use some form of eLearning in their training.
6. More than 40% of Fortune 500 companies use online learning regularly as part of their training approach.
7. Or, according to this more recent data, 99% of organisations provide eLearning to their employees, in contrast to just 76% only 5 years ago.
eLearning vs Classroom Learning Statistics
The popularity of online learning has skyrocketed. It has easily become the most attractive form of distance education. As a result, more and more organisations and institutions are offering some form of eLearning.
Meanwhile, some leaders and decision-makers are still objecting to online learning due to common misconceptions about its price and effectiveness. As such, we have collected some statistics comparing online and classroom learning.
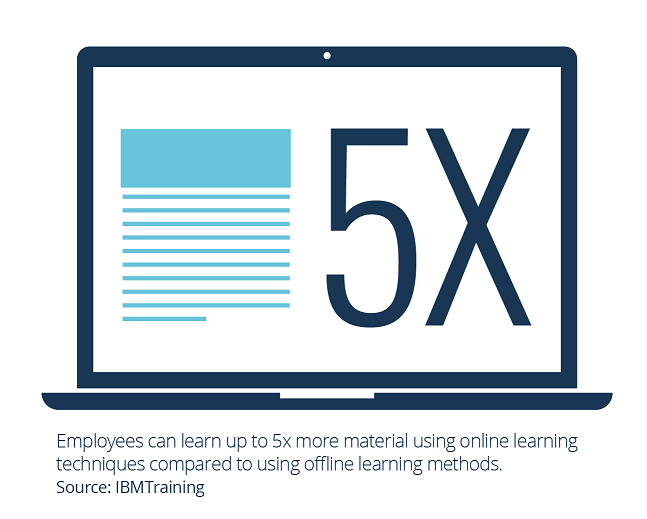
8. IBM found that their employees learned 5x more material using online learning techniques compared to using offline learning methods.
9. Online learning takes 40% to 60% less employee time than traditional face-to-face learning. This reduces training costs and means that employees can get back to their work tasks quicker. A win-win, if you ask us!
10. Online learning may increase retention rates by as much as 60% compared to the 8-10% retention rate of typical classroom training.
11. Online courses have a completion rate of between 12-15%, compared to the 4-9% completion rate for traditional classes.**
12. The biggest motivators for employees to choose online learning (rather than traditional classroom-based learning) are individual learning pace (95%) and minimised travelling (84%).
13. 90% of students prefer eLearning to classroom-based learning, due to its flexible and accessible approach.
14. Similarly, 85% of these surveyed learners say that their online learning experience was better, or at least equally as satisfactory, as their traditional face-to-face classes.
15. And one more: 77% of surveyed learners believe that remote learning experiences are just as effective as traditional classroom-based learning.
LMS Statistics
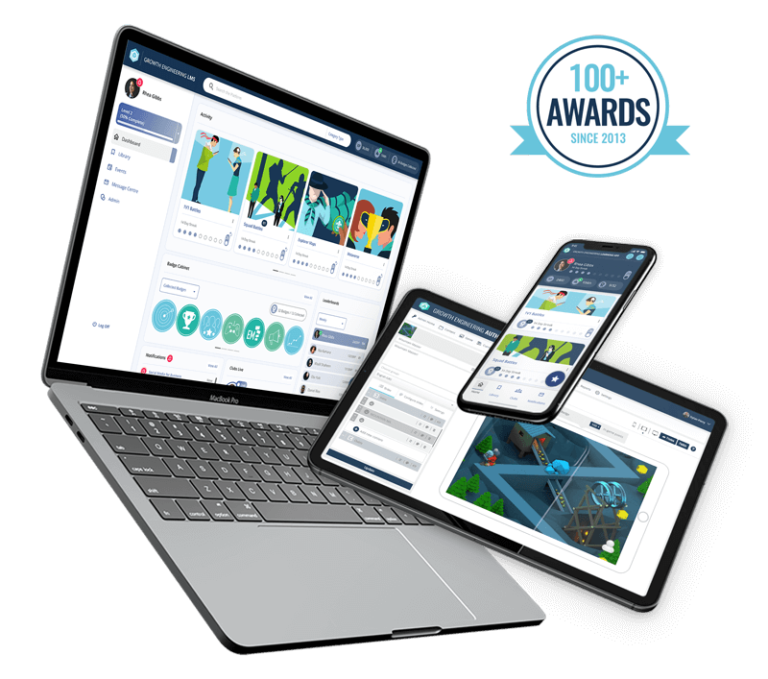
A learning management system (LMS), like Growth Engineering LMS, is an online software solution used to support employee training. An LMS helps you to develop and share eLearning units effortlessly. What’s more, it’s useful for anyone with a hunger to learn! Want to see the power of an engaging LMS? Then keep on reading!
16. At least 83% of organisations currently use a learning management system.
17. An estimated 73.8 million people use learning management systems. And in our opinion, you should be one of them!
18. LMSs are the most commonly used learning technology (89%), followed by rapid eLearning tools (44%) and mobile applications (31%).
19. The majority of LMS administration is handled in-house (83%), whilst 23% of organisations choose to outsource their LMS operations.
20. 55% of learning management systems are deployed on the cloud, whilst 45% are on-premise solutions.
21. Unfortunately, 50% of L&D professionals do not believe that their learning systems are fit for their workforce. Ouch!
22. Indeed, only 22.9% of survey respondents claim that their LMS solved the ‘right problems’ for their organisation.
23. 44% of organisations were found to be unhappy with their current LMS.
24. 1 in 4 survey respondents plan to change their LMS provider. We have a recommendation for them.
25. Poor usability (53%) and high cost (44%) were seen as the biggest factors that cause learning leaders to seek out a new and improved learning management system.
Learning Technology Feature Statistics
Learning management systems and learning apps offer a vast toolbox of features, but not all are created equal. To find the perfect fit, you’ll probably have a selection of ‘must-haves’ and ‘nice-to-haves’. Here, we’ve analysed the data to reveal the features that learning professionals value most.
27. 93% of L&D professionals want to bring live online learning, such as virtual classrooms, into their LMS.
28. 82% of L&D professionals say that reporting and analytics are an important feature on their LMS.
29. 90% of learning professionals agree that learner engagement is important within a learning system.
30. 35% of learning professionals would like to incorporate user-generated content within their learning programmes.
31. 58% of L&D professionals want to introduce social learning to their online learning technologies. We have seen the benefits of social learning, and that’s why we have added various social elements into our products.
32. Functionality was chosen by 39% as the most significant priority when selecting a new LMS. The other considerations focused on reliability (20%), training support (17%) as well as price (12%).
33. 23% of large companies incorporate VR, 11% use AR, and 9% AI technology in their learning technologies. In contrast, only 5% or less of small corporations incorporate similar methods.
Learning Technology Evaluation Statistics
Choosing the right LMS or learning platform is crucial. For most L&D teams, it’s a significant investment that shapes future learning initiatives. That’s why we created this checklist to help guide the process. We’ve also collected all the statistics we can find about the evaluation and selection process below.
34. There are as many as 800 different LMSs in the market, each with their own feature set and benefits.
35. LMS pricing varies depending on the number of users on the platform. A typical setup fee will range between $4,000 to $40,000. The monthly licence fee will vary between $2 to $5 per user.
36. A Training Industry survey suggests that training budgets will increase by 8% in 2024.
37. Only 45.4% of learning professionals consider themselves ‘very knowledgeable’ about the LMS selection and implementation before embarking on this process.
X. The majority (51%) of those surveyed by Capterra said that they demoed 1-2 products before making a decision. Only 3% said they purchased an LMS without demoing the product. That’s still 3% too many in our opinion!
38. 23.4% of learning professionals spend longer than 6 months evaluating the LMS market before selecting a supplier. 13.8% spend less than one month.
39. 33.3% of learning professionals change their selection criteria during the LMS buying process.
40. 74.1% of learning professionals use vendor demonstrations to guide their selection strategies. 63.3% utilise a testing sandbox and only 42.2% conduct user testing.
41. The key LMS selection criteria are features (81.9%), price (67.5%) and support services (51.2%).
eLearning Creation Statistics
Now that your learning platform is up and running, it’s time to fill it with engaging learning content. You have several options: develop your content in-house using an authoring tool, outsource creation to a third-party, or leverage a pre-built content library. The statistics below may help you to navigate this crucial decision.
42. Companies spend $340 billion on employee training and development, averaging more than $1,500 per employee per year.
43. It takes an average of 197 hours to develop a 1-hour eLearning course, however the time spent can vary between 49 to 716 hours.
44. A typical 1-hour eLearning course will cost $9,826 for an employee to develop.
45. Content creation vendors will typically charge between £25,000 ($31,200) and £30,000 ($37,440) for 1-hour of content created from scratch.
46. 53% of course creators spend 3 months or longer creating their eLearning courses. This is a painstaking process!
47. According to Podia, the average online course price is $137.
48. Users who pay for their courses spend 10% more time within their course portal.
49. Over half (52%) of eLearning course enrollments never translate into active participation.
Microlearning Statistics
Microlearning breaks hefty learning interventions into smaller chunks. The smaller units are easier to consume as learners can explore the material at their own convenience and pace.
Got a spare five minutes while waiting for a meeting to start? Great! That’s all the time you need to complete a microlearning unit. In the end, these small efforts will make a significant impact! We already know how powerful microlearning can be, but check these stats for yourself!
50. How much beneficial training could you get done in under 30 minutes? On average, employees can dedicate just 1% of their workweek to professional development. That 1% is the equivalent of 24 minutes a week.
51. According to the Forgetting Curve introduced by German psychologist Hermann Ebbinghaus, we forget a whopping 90% of what we study within 7 days if we don’t try to retain the information!
52. Research shows that microlearning is 17% more effective in transferring knowledge compared to traditional classroom training.
53. What’s more, bite-sized content has been shown to increase information retention by 20%. As such, microlearning is the key to maximise training time and effectiveness.
54. People also prefer learning in short bursts. 58% of employees said they would be more likely to do online training if the content was broken into smaller chunks.
55. One of our Fortune 500 customers saw the impact of microlearning first-hand when they introduced our mobile app solution, Growth Engineering Learning App. Initially, their target was to encourage spending 20 minutes on the app a month. The mind-blowing results show that the actual average reached 2 hours and 23 minutes.
56. According to Dr Jimenez, microlearning can cut development costs by 50%. On top of that, it can increase the speed of development by 300%. Impressive!
57. Microlearning now accounts for more than 60% of all online learning experiences. That alone speaks for itself!
58. 47% of L&D teams plan to deploy microlearning programmes in 2024.
eLearning Approaches Statistics
There’s more than one way to crack an egg. While traditional eLearning excels, innovative methods like social learning, mobile learning and mentorships (delivered through online platforms) are making waves. Dive into the statistics below to see how these approaches are revolutionising education.
59. Social learning has been shown to increase course completion rates by up to 85%.
60. Social learning contributes an impressive 75:1 ROI over traditional web-based training.
61. 70% of learners are more motivated to learn when they use mobile devices instead of computers.
62. 47% of companies are investing in career mentoring and coaching.
63. Only 33% of organisations have internal mobility programmes.
Gamification Statistics
Gamification means taking the mechanics that work so well in games and applying them to other contexts, such as L&D. Our mission here at Growth Engineering is to fight against dull online learning, and gamification is one of our favourite allies!
Gamification brings the joy back into online learning by adding fun and engaging game elements. Still wondering how effective it can actually be? The following statistics show how gamification can boost online learning!
64. 78% of employees feel that they would be more prone to work for a company that uses gamification in the recruitment process.
65. 89% of employees estimate that they would get better results if their work were more game-like. And can you blame them? Playing games is fun — and imagine improving your learning outcomes at the same time.
66. Gamification also has a big impact on our productivity! 72% of employees believe that gamification motivates them to work harder.
67. T-Mobile, for instance, learned how gamification can increase employee engagement. Just six weeks after introducing gamification elements, T-Mobile awarded 187,000 achievement badges to their learners!
68. 26% of learners wish their LMS had gamified elements. That’s more than one in four users!
69. That doesn’t come as a shock since 95% of employees say they enjoy using gamified systems.
70. It takes 400 repetitions to make a new synapse in the brain. But did you know that gamification can reduce the needed iterations to 20?
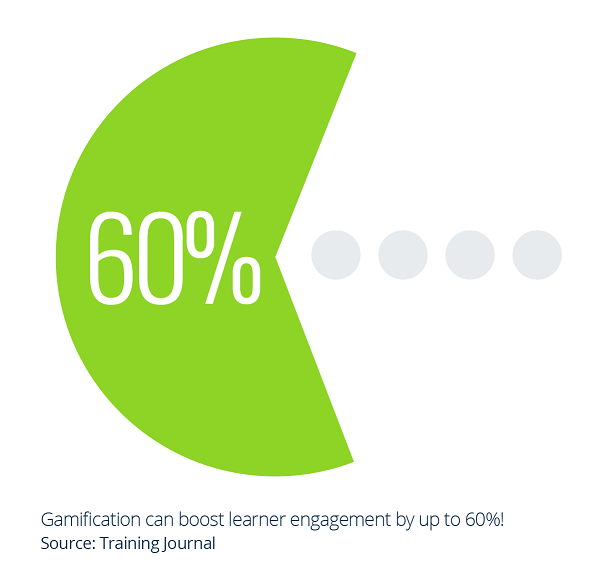
71. So, it is no surprise that gamification can boost learner engagement by up to 60%!
AI Statistics
Artificial intelligence (AI) is a game-changer for learning professionals and L&D teams. We’ve already seen an explosion of AI tools designed to streamline workflows, reduce costs and enhance learning outcomes. Words can’t fully capture the magnitude of this opportunity, but the data below offers a glimpse.
72. 4 in 5 learning professionals want to learn how to use AI in their workflows.
73. Just 12% of L&D professionals think the impact of AI in learning is overhyped.
74. By the end of 2024, 47% of LMSs will utilise AI tools and capabilities.
75. Almost half of students (47%) claim that AI has already had a positive impact on their overall learning experience.
76. Research shows that AI-powered personalised learning solutions can improve assessment scores by 8.1 points and increase engagement up to 42.3 minutes per session.
eLearning Business Impact Statistics
We’ve seen how popular and effective eLearning is, so let’s look into the impact it can have for your business! Investment in an innovative LMS can result in better productivity, higher employee engagement and reduced training costs.
However, it is worth noting that, like with most products, no one solution fits all. That’s why our learning technologies are fully customisable to suit your business objectives!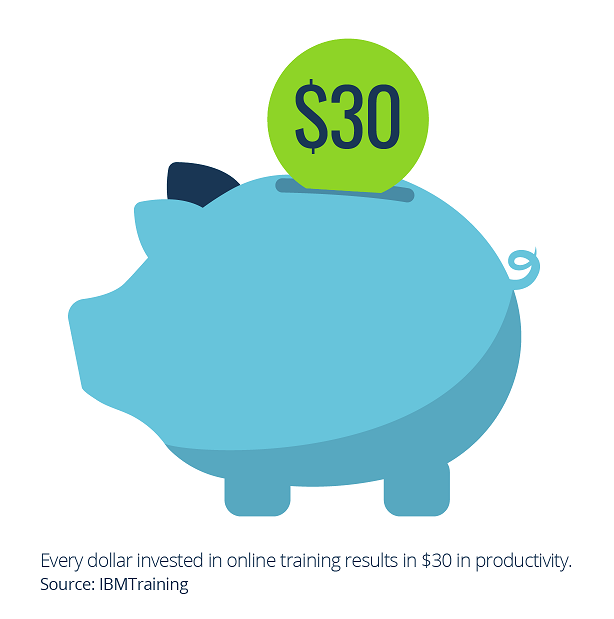
77. Corporate eLearning can increase engagement by as much as 18%! AstraZeneca, an international pharmaceutical company, needed to teach 500 sales employees about a new release. 95% of their learners completed all available training modules!
78. Hendrick Automotive Group, the largest privately owned automotive dealership in the US, also saw amazing engagement after replacing their old fashioned LMS with our engagement-focused platform. As a result, the organisation saw over 750,000 visits on the learning management system in just eight months.
79. 5,500+ L’Oréal Travel Retail learners using Growth Engineering Learning App generate 18,400+ social engagement every day. Territories using the app solution have seen an average 20% increase in sales revenue.
80. 92% of EE learners using Growth Engineering LMS agree that their digital skills have increased.
81. HP learners using Growth Engineering Learning App complete 19.3 Knowledge Contests every month.
82. GAME Retail’s LMS generated a 94.3% increase in average basket size, linked to a specific training campaign.
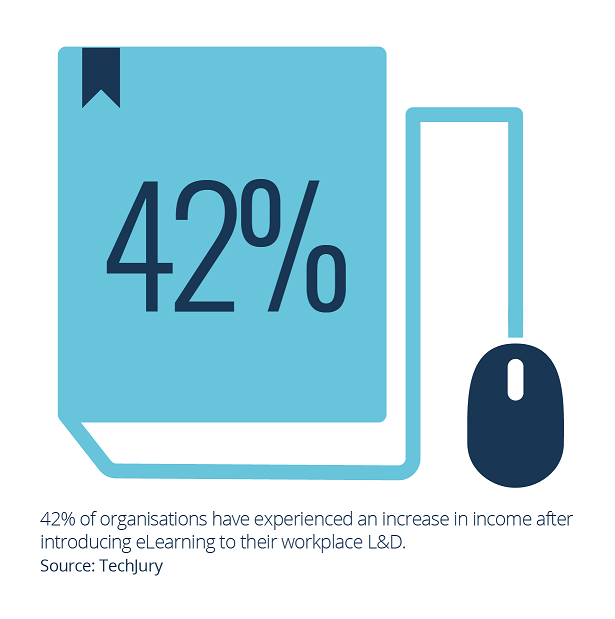
83. In fact, 42% of organisations have experienced an increase in income after introducing eLearning to their workplace L&D! Are you convinced yet?
84. IBM also studied the value of workplace training, and found that every dollar invested in online training results in $30 in productivity, as workers learn quicker and can resume to work faster. Consequently, after moving to online learning, IBM saved nearly $200 million!
85. Dow Chemicals saved $34 million by switching to eLearning tools. This was driven by reducing training costs from $95 per learner to just $11 per learner.
86. So, it comes as no surprise that 72% of organisations believe that using online learning creates a competitive advantage for the business.
Learner Sentiment Statistics
Understanding how your learners think, feel, and approach online learning is key to maximising their success. What makes them tick? What are their needs and preferences?
By delving into the data below, you’ll gain valuable insights that help you to capitalise on your learners’ motivations and refine your learning experiences. A thriving online learning environment awaits!
87. Let’s start with a no-brainer! 94% of employees say that they would be more willing to stay in a corporation that invests into employee training and development. That alone emphasises the importance of an efficient approach to L&D.
88. 7 in 10 people say that learning opportunities boost their sense of connection to their organisation.
89. 8 in 10 people say that ongoing learning initiatives add purpose to their jobs.
90. 53% of Gen Z value learning for career progress, in contrast to 37% of Millenials, Gen X and Baby Boomers.
91. 55% of employees say they need additional training to perform better in their role.
92. 75% of employees are satisfied with the learning and development opportunities provided by their organisations.
93. As many as 33% of learners lack motivation to complete their training and 25% of learners lack the time they need.
94. 77% of global workers are ready to learn new skills, and 74% see training as a matter of personal responsibility.
95. 60% of students report that online learning has had a positive impact on their soft skills.
96. 94% of online learners prefer to study at their own pace.
Other eLearning Statistics
Congratulations, we’ve almost made it to the finishing line. These eLearning statistics didn’t fit neatly into any of the previous categories, but they still offer valuable insights.
97. Focus on employee retention is at an all-time high, with 90% of companies prioritising learning initiatives as their leading strategy to keep their employees on board.
98. While we care about you and your learners, we also care about our planet! Online learning can cut energy consumption by 90%.
99. On top of that, eLearning produces 85% fewer CO2 emissions per person. Amazing, huh!
100. 91% of L&D professionals agree that soft skills are increasingly important.
101. 91% of managers believe that eLearning will help to close skill gaps within their teams.
Final Words
We see online learning as the future. Like these X online learning statistics show, the industry has experienced an immense growth period in the last 20 years. More importantly, the market is not showing any signs of slowing down! As such, in the right hands, these new engaging learning technologies can create a meaningful business impact.
Want to learn more about how our learning technology solutions can improve your employee training and help you to achieve your organisational goals? Or perhaps you are after similar online learning success that these statistics manifest?
Growth Engineering LMS is our very own award-winning learning management system that uses the power of engagement, behavioural science and learning best practice to drive results. Book a demo now!