
Virtually every training department in the world does some form of post-event evaluation. Instead of giving your stakeholders data that looks something like this…
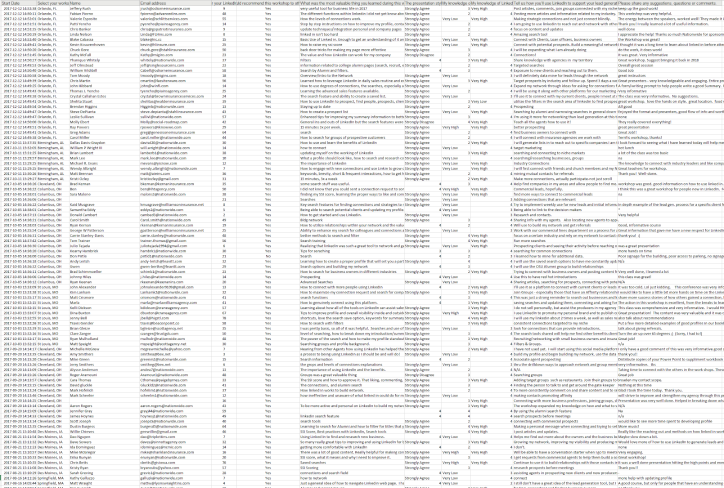
Egad….nobody is going to read that! Which is exactly why it is a wise investment of time to transform this information into something more digestible. Think about the top things you want people to take away from your data are and create reports that highlight those things. If you make them do the work of figuring that out, you’ve already failed.
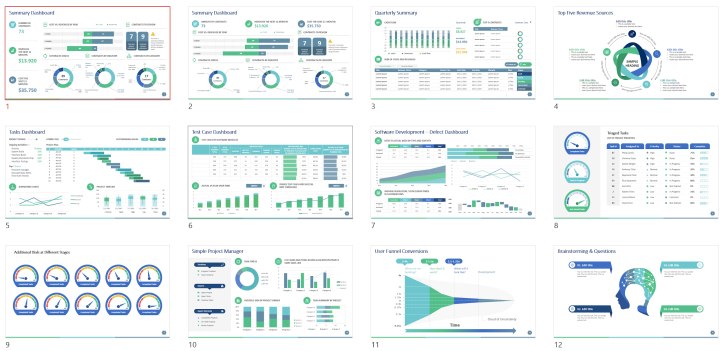
Here’s an example of the infographic dashboard report I created for a series of workshops we did for Nationwide last year.

Based on conversations with stakeholders, we highlighted three key items and supplemented those with some representative comments. Of course, they also got a copy of the detailed data in spreadsheet form if anyone ever wanted to dig deeper into the details.
This format gives a nice “at a glance” perspective on each workshop we ran. We created it in PowerPoint and delivered it as an easily shareable PDF.
Grab a free training evaluation report template
Here’s the template I built. Feel free to download a copy and tweak it to make it work for you. Change the color scheme, add your own logo, adjust the slide layout…whatever. Let me know if you have any questions or trouble.

Download my Training Report Infographic PowerPoint Template
Once you’ve landed on a template that works, save it as a PowerPoint template (.potx) in this location on your hard drive (Windows) so that it is instantly available whenever you need it:
C:\Users\[username]\Documents\Custom Office Templates

Ann Emery outlines a similar approach in her excellent “How to Visualize Workshop Evaluation Results” post.
Other Helpful Resources
Need to include a bit more data or experiment with more options? You might want to check out this KPI Report template from YouExec.
Also worth a look:
- Interested in asking more valuable evaluation questions? Check out what Brian Washburn and Will Thalheimer have to say on that topic. Also, while you’re there take Will’s Smile Sheet Diagnostic.
- Not sure what type of charts to use? Check out Stephanie Evergreen’s Chart Chooser tool.
- Need some tips for working with that speedometer chart?
- 10 Tips for Creating Reports People that People Want to Read by Taylor Croonquist
I’d love to see what others are doing. What does yours look like?

One thought on “Visualize Your Training Data with an Infographic Report + Free Template”