
If you are a modern elearning course developer or learning experience designer, the following assumptions are most likely to describe your work:
- You use an authoring software tool such as Articulate Storyline or Adobe Captivate
- You define successful course completion by either the number of slides the learner has viewed or the final quiz score
Such scoring and reporting certainly check the box when it comes to compliance tracking, but they don’t necessarily describe the effectiveness of your elearning course. What they do is ensure that there is a record of the training. In this day and age, when many learning and development professionals are focused on being compliant rather than taking time to produce effective learning interventions, these final quiz scores or percentages of slides viewed have somehow come to mean that the training is (or isn’t) effective. There’s no need to explain why this approach is not ideal, to say the least. After all, we know with high certainty that content consumption does not equal skills acquisition.
So how can a company tell if the elearning course is effective? The best option, of course, is to observe the learners’ behavior after completing the training and note any positive changes that can be attributed to the training. While this is the ideal approach, in many cases it’s not feasible because many course developers simply don’t have access to staff performance data. So we’ll work with the data that we do have – learner’s behavior inside the course. In fact, collecting and analyzing learning data is becoming a major elearning trend. In this article, we will show how to use the Data Cloud widget for Articulate Storyline to gather the learning data that will allow you to understand the training effectiveness and come up with strategies that can help you make elearning effective. Note that while we are using Articulate Storyline in this example, you can take a similar approach when working with Adobe Captivate.
Step 1: Paying attention to individual knowledge check answers.
To make these examples as robust as possible, we will assume that you are familiar with the Data Cloud widget. Don’t worry if you haven’t used this tool before, it’s easy to get started with, and you can start collecting learning data with very little effort. For extra help, feel free to read our article about saving the learning data outside the LMS. Alternatively, you can use any other tracking tool that allows you to capture the learning data.
We will start assessing the training effectiveness by looking at responses to individual questions in the knowledge check. Here are the steps we will take:
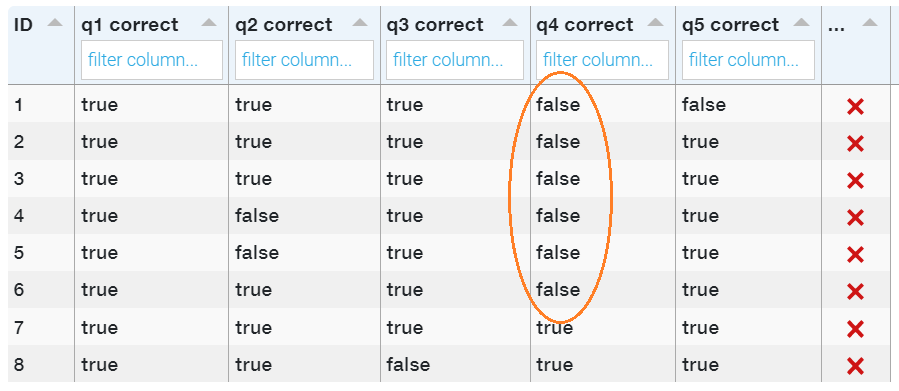
- Set up a Data Cloud table showing 5 fields—one for each question (we have 5 questions in this example).
- The value will be TRUE if the learner has answered the question correctly and FALSE in the case of a wrong answer.
- We named these fields “q1 correct,” “q2 correct,” “q3 correct,” “q4 correct,” “q5 correct.”
After several learners have taken this learning module, we check the data to see if there’s a pattern. Below, you can see a screenshot of the report. Looking at the data, we can clearly see that most learners had issues with question #4. This is a good place to start evaluating the training content. Here are some questions to ask ourselves:
- Did we explain the content properly?
- Was the learner able to link the training content to the question content?
- Are more explanations needed on this topic?
- What else can we do to make the material presented in this elearning course more effective?
Step 2: Looking for unexpected behavior.
After studying the data in step one, we look at the learning content to reevaluate the material we test in question 4. One of the slides has a “Show Examples” button that brings up additional explanations and examples when clicked. We decide to check whether the learners click on that button. And if they do, we want to see how it affects the learning outcomes. To do this, we:
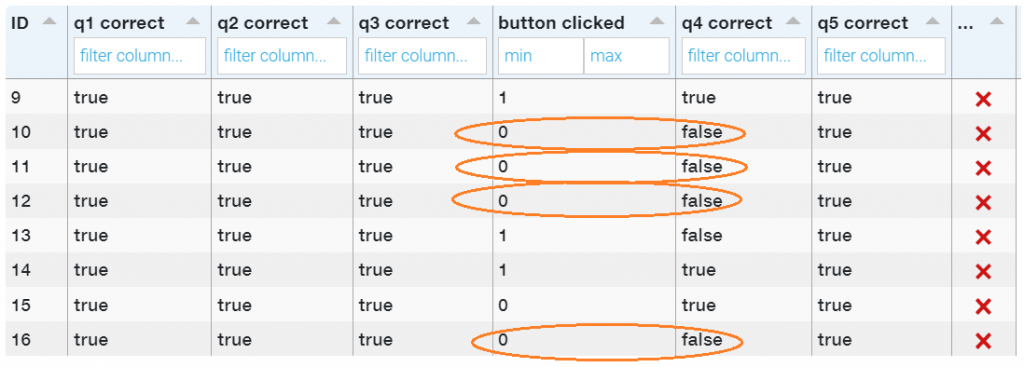
- Add another field to the data table and call it “button clicked.”
- We’ll set this field as numeric purely for presentation purposes (to make the column stand out from other fields in the data table).
- Zero will mean that the learner has not clicked the button, one will indicate a click.
We allow a group of learners to take the course. Next, we check the report to see if there’s a correlation. Particularly, we look at how the “Show Examples” button clicks correlate with question 4 outcomes. In fact, the data does show a strong correlation there. The table below clearly demonstrates that almost all of the learners who didn’t click on the button selected wrong answers in question 4.
Step 3: Making predictions.
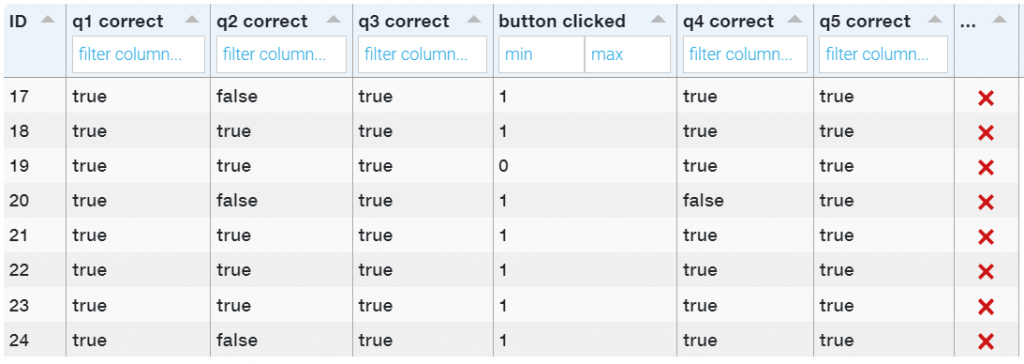
Next, we make a prediction that if we display the button more prominently on the slide and change its caption to “Continue” instead of “Show Examples,” more learners will click on it. We could simply restrict the course navigation, but we trust our learners and want to keep the navigation open. So, we make the changes to the button and allow some more learners to take the course. Upon checking the report, we notice that the changes we’ve made resulted in more button clicks and improvements in question 4 scores. We can also say that these changes allowed us to make the learning process more effective.
Step 4: Drawing conclusions and acting on findings in order to make elearning effective.
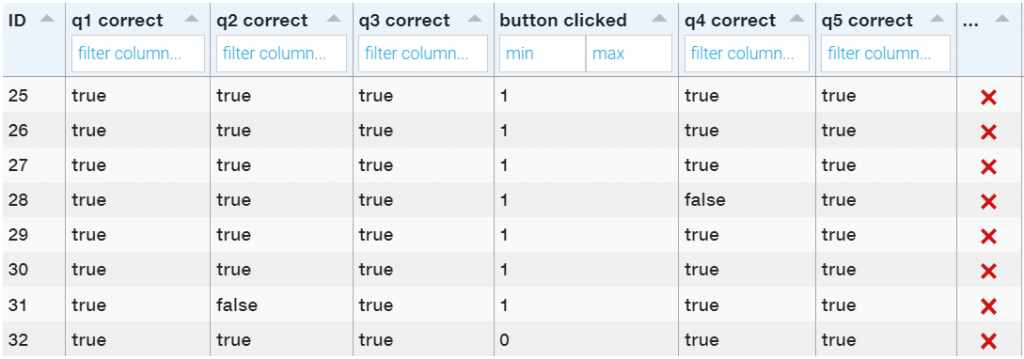
Finally, we can draw conclusions and sum up the findings. We have discovered that displaying the button prominently on the slides and changing the caption to “Continue” resulted in better learning outcomes. Let’s now apply this finding to the rest of the course. We know that the content in question 2 is also partially hidden behind another “Show Examples” button. We will make the same changes to this button and will test this course with the learners one more time. The table below illustrates that these changes have also resulted in performance improvements in question 2.
In summary:
Of course, a record of what the learners are reading and seeing is just that, a record. It does not measure how skilled the learners are in performing their job tasks. However, by paying attention to the learning data generated in the course, we have the ability to fine-tune the courses we build. This has the potential to make elearning effective and result in stronger knowledge transfer.
Collecting and analyzing learning data is becoming a major eLearning trend.
Companies should pay attention to the learning data generated by the learners to improve the content presentation and make the eLearning course effective. A company can tell if the eLearning course is effective if they see any positive changes after the learners complete the training.
A good place to start evaluating the training content is to use the Data Cloud Widget. Pay attention to the learners’ knowledge check answers. Check if there is a pattern or if the learners have issues with any questions.
Software tools such as Articulate Storyline and Adobe Captive allow capturing a record of the training and saving the data with the Data Cloud widget.
The quiz scores and course progress reflect only course completion and not necessarily the effectiveness of the training.

