
EDITOR’S NOTE: Because extended enterprise learning involves multiple disciplines, we sometimes ask other experts to share their insights with our readers. Today we feature advice about performance dashboards from Laura Patterson, President of VisionEdge Marketing.
Laura is widely recognized as an authority in marketing measurement and performance, content management, marketing operations and data analytics. Her guidance is also useful for business-minded learning professionals.
Data Dashboards Everywhere!
These days, nearly every business technology platform offers some type of performance report or dashboard capability. We now expect one-click access to data from tools we use for email campaigns, social media and web content management. And we expect no less from more sophisticated systems that drive marketing automation and customer relationship management.
Although these dashboards offer easy access to information, it’s important to remember their limits. For example, charts typically reflect only the data collected with each platform.
However, our goals are usually more expansive. We want to understand how marketing activities work together to impact business outcomes such as category ownership or comparative growth rates.
Does Your Dashboard Separate Signal From Noise?

The most effective dashboards focus on highly relevant information that demonstrates business impact and facilitates strategic decision-making. This requires us to gather and integrate data from multiple sources.
Sounds straightforward enough. But the trick in building and leveraging this type of dashboard is the ability to identify the most meaningful data and make sense of it. And that depends on how well you separate the signal from the noise.
This signal-to-noise (SNR) concept is a ratio used in science and engineering to measure the strength of a relevant signal to irrelevant background noise. When SNR is low, the signal (in this case, salient performance information) gets lost in the noise (all the background data). Conversely, as SNR increases, the signal becomes more clear.
Why Does Signal-to-Noise Ratio Matter?
Because I’ve spent a great deal of my career among engineers, I learned the importance of separating relevant versus irrelevant data. And when we apply this signal-to-noise ratio idea to marketing dashboards, they become more useful.
Think of it this way: When your dashboard is overloaded with data, your ability to find and focus on meaningful insights can be obscured by random superfluous or irrelevant information. Learning how to distinguish important data can help you measure performance more effectively and help your organization make actionable decisions with greater confidence.
Before we explore how to construct a meaningful marketing dashboard, let’s explore how to increase your SNR ratio.
Why Quality Data Leads to Terrific Dashboards
Too much data is one of the primary culprits of noise. But simply reducing the total volume of underlying data doesn’t necessarily produce a higher-quality dashboard.
No matter how much data you process, you need to make sure you have the right data.
This is why it is important to remember that any dashboard – for marketing or any other function – must answer the proverbial question, “So what?”
If it doesn’t facilitate an action or a decision, what is its purpose?
An Everyday Example: Your Car
Think about the dashboard of your car. Those visual analytics are based on a lot of data, but each widget is a key performance indicator (KPI) that serves a specific, important purpose:
- The speedometer helps you decide if you’re driving within the legal limit.
- The fuel gauge helps you decide if you have enough fuel to reach your destination.
- The average-miles-per-gallon tracker helps you decide if your car is operating as efficiently as you’d like.
An effective marketing dashboard plays a similar role. It should include indicators that help decision-makers address key performance questions. For example:
- Which business processes are affected by marketing, and to what degree?
- Are you meeting specific performance targets?
- What is or isn’t working? What tactical adjustments are recommended (if any)?
- What strategic decisions should be made regarding customers, products and competitors?
- Where risks are emerging, and what’s the severity of those risks?
This is the first step in creating a high signal-to-noise dashboard. Determine the decisions and actions that matter most to your business. Then select ONLY relevant dashboard indicators.
How to Improve Dashboard Data
We’re bombarded with so many real-time dashboard metrics, it’s easy to be sucked-in by the sheer volume and flow of dynamic activity data. Perhaps that’s why professionals spend a tremendous amount of time and energy monitoring website traffic and social media activity as it occurs.
However, real-time dashboards can be harmful because they tend to increase the overall noise level, and cause knee-jerk reactions to data that hasn’t been contextualized. To minimize these issues, try these techniques:
1) Expand Time Intervals
Tracking and reporting time series data over longer periods (months instead of days, for example) can help you avoid short-term noise dynamics, so you can identify the most salient data patterns.
This can also help you identify acceptable measurement parameters and define appropriate “exception alert” thresholds – the same way your car dashboard is designed to alert you when fuel dips below a specific level.
2) Smooth Your Data
Data smoothing is particularly important. This makes it easier to identify core patterns, so you can begin to isolate issues and analyze underlying drivers.
A variety of sophisticated statistical techniques can help you with data smoothing. However, simply calculating a moving average over multiple equivalent intervals is fairly easy and usually reasonably effective.
For example, it may be helpful to track growth in customers and purchase volume with a one-year monthly trailing moving average. This kind of time series analysis provides more meaningful information than actual monthly values, especially when activity is characterized by frequent peaks and valleys that reflect seasonal fluctuations or other factors.
Averaging data over time also helps reduce noise when your data involves win/loss ratios, net new opportunities and other pipeline metrics that can change dramatically from week-to-week or month-to-month.
3) Combine Indicators
Another way to reduce noise is by combining multiple indicators. This can be effective even when measures represent somewhat different concepts. For instance, you may want to combine measures of actual spend with cost-per-unit (such as cost-per-lead, cost-per-acquisition, cost-to-serve and so forth).
Because these indicators are conceptually different, they will track differently, even if they’re measured perfectly. But by combining them, you can build a more complete picture of the fundamental “value for money” trend.
In addition, combining different measures of the same concept can help improve the accuracy of your estimate.
Closing Notes
Focusing only on relevant data will ensure that you get the most value out of any performance dashboard. For more ideas about how to improve your marketing measurement methods, see related posts and other resources on the VisionEdge website.
EDITOR’S NOTE: This post has been adapted, with permission, from a post published on the VisionEdge Marketing blog.
Share This Post
About the Author: Laura Patterson
Related Posts

Top LMS Selection Speed Bumps: Customer Ed Nugget 18
If you're a customer education leader, sooner or later you'll need to choose a learning system. How can you avoid LMS selection speed bumps? Find out in this Customer Ed Nuggets podcast

CEdMA Conference Takeaways: Customer Ed Nugget 17
What's top-of-mind among customer education professionals these days? Join Analyst John Leh and industry leader Kristine Kukich as they compare notes from the recent CEdMA Conference
The Future of Customer Education: Customer Ed Nugget 16
Customer education is rapidly evolving as organizations embrace new strategies and tech. What does this mean for the future of customer education? See what experts say on this Customer Ed Nuggets episode

Education Strategy Mistakes to Avoid: Customer Ed Nugget 15
What does it take to deliver a successful customer education program? It starts with a solid education strategy. Learn how to avoid common pitfalls on this Customer Ed Nuggets episode
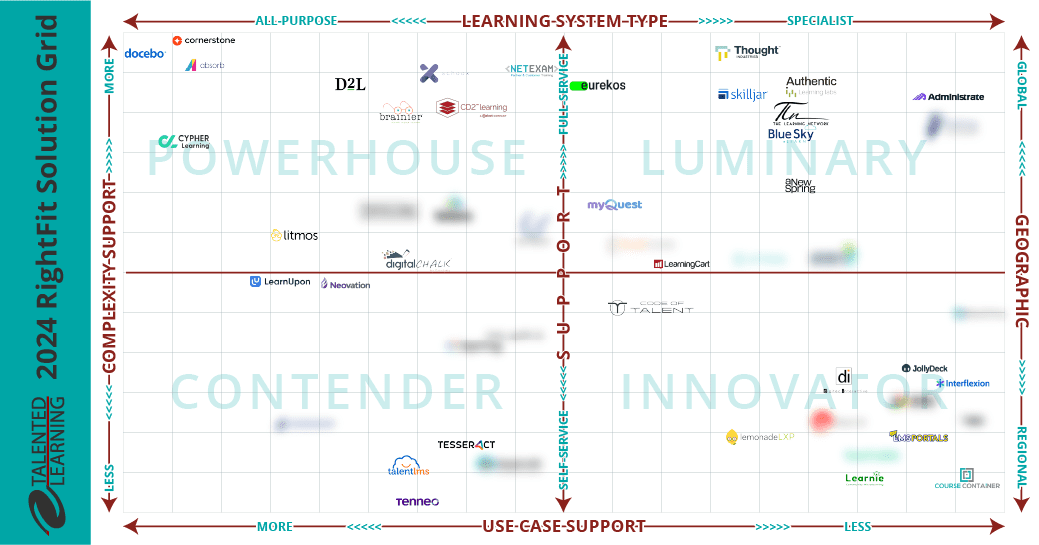
Which LMS is Best for You? New Shortlisting Tool for 2024
How can you find the best learning system for your business? Our LMS shortlisting tool can help. Learn about the 2024 RightFit Solution Grid. Free, reliable guidance based on our independent research

How to Build a Learning-Based Business: Executive Q&A Notes
Building and selling online courses may seem easy, but building a profitable learning-based business is far more complex. Find out what successful leaders say about running this kind of business

The Rewards of Community Building: Customer Ed Nugget 14
What role does community play in your customer relationships? Find out why community building is such a powerful force in customer education on this Customer Ed Nuggets episode

Benefits of Training Content Syndication: Customer Ed Nugget 13
If you educate customers online, why should you consider content syndication? Discover 10 compelling business benefits in this Customer Ed Nuggets episode

Top Marketing Skills to Master: Customer Ed Nugget 12
Successful customer education programs depend on professionals with expertise in multiple disciplines. Which marketing skills lead to the best results?

NEW! LEARNING SYSTEMS DIRECTORY

LMS BUYER SERVICES

ON-DEMAND WEBINARS

CASE STUDY DIRECTORY

FOLLOW US ON SOCIAL