


- Blog
- How learning Bursts Support Attention and Memory
Can-Do Training Metrics Tactics: From Measurement Plans to Automated Learning Analytics Dashboards
-
 Kate Worltom-Pulham
-
 October 6, 2022
When he was devising a learning measurement framework, Kirkpatrick may have mused on the aphorism that goes, ‘If you fail to plan, you plan to fail.’ For those of us who want our training effectiveness to be defined in Kirkpatrick Levels beyond 1 and 2, measurement would ideally be automated; but we too-often remain mystified at that prospect, as the familiar one that goes, ‘Automation cannot think for itself’ repeats in our heads. But budget-agnostic, learning analytics and measurement strategies don’t have to be out-of-reach if you plan for them with the right (manual and automated) analytics tools before the first module is even outlined.
It’s not shameful to admit that the word “analytics” can seem somewhat radioactive—scary, but accepted as powerful and beneficial, if correctly applied. Read on to discover manageable and reasonable methods — some low-tech, some higher-tech — for tracking learning measurement from the start. No need to worry. We have this.
Start the Learning Initiative with a Realistic Measurement Plan
Many organizations think about measuring performance results only after the training has happened. At best, this approach will benefit only the lucky ones with built-in performance metrics and analyst teams who might even have existing software to link training evaluation to performance measurement. If your organization is not among those fortunate few, take heart. Any org can team-up—internally or with learning and performance measurement consultants—to design a learning solution that leads toward the business goals. Here’s how.

- First, start any learning initiative by designating each metric, KPI, and business needle that needs to move. How does each need to increase or decrease? In what amount of time? How will the change in each metric affect the other metrics? Which stakeholders need to weigh in on these goals? And most importantly, what performance behaviors will lead to this desired change and what behavior gaps are preventing it and why? Believe it or not, answering all those questions can be more straightforward than you’d think.
- Second, outline how each metric will be measured. By what units? By what measurement mechanism? Is there an existing mechanism, or does one need to be designed and created? Who will monitor the measurements over time? At what benchmarks?
- Third, what specific data reviews, insight discussions, and action decisions particular to each organization and at each benchmark will help refine the learning and performance’s impact on the business?
It’s not too much on the plate if you break down a measurement plan into small bites, so that it can become digestible. But don’t expect needles to fly off the meters in the optimal direction at Benchmark 1. Results will take patience. But if results-engineering is carefully calculated at the outset of the learning initiative, it’s worth the wait. (Yes, even in revenue.)
Push Learning Measurement beyond One Post-training Performance Evaluation
Designating what needs to change in the business and fueling that with the right performance indicators is Step-1 performance mapping. It’s time to move beyond that to strike some change in numbers over time. Step 5 might be a robust measurement strategy in which measurement happens before, during, and after the learning experience: getting better and certainly achievable. But we want to move the industry and the businesses we serve forward to Step 10, in which an automated dashboard system quantifies learning early in the design process and throughout the learning experience so learning and performance analytics are updated and accessed live. Dashboard views for the learner, their manager, competency designers, L&D leaders and teams, HR skills auditors, and so on can be customized with the types of data and learning evaluation levels at designated benchmarks from which each dashboard user will benefit.
The higher-tech solution makes sense of a multi-faceted learning ecosystem, considering all the users within it. This sample customizable learning analytics dashboard has selectable benchmark, user, learning evaluation level, course, module, engagement data, application data, and linked performance data views, their corresponding control data, as well as KPI progress per metric goal change over time.
But the data do little good if you stop there…
Don’t Stop at Data Points: Turn Data into Impact
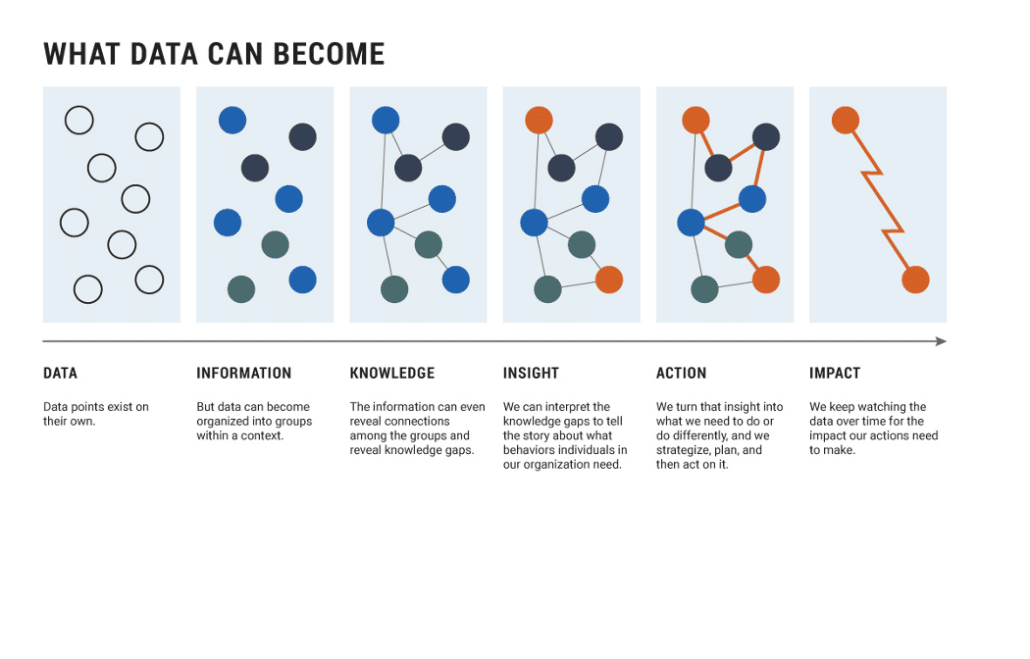
For data not to stop short of its potential, learning teams should consider data points as disparate seeds with the promise to burgeon into the targeted business impact with the right analysis and action. Whatever data the initial learning solution measurement plan gathers, the plan should define how the team should turn data into information, then information into knowledge, knowledge into insight, insight into action, and action into the impact that the business needs most.
Accordingly, the learning analytics dashboard doesn’t stop with just data. With the next click, it can serve up insights based on data ranges from data aggregation, and even suggest action from that insight. From there and at each subsequent benchmark, learning and development teams with performance and measurement consultants can have further structured conversations to plan the learning and performance action and impact strategy driven by the data insight.
For example, the dashboards can then deliver a personalized Learning Pathway to the learner…with built-in manager views and manager support. This can take the shape of, say, collaborative learner Development Planners that automatically push refresher learning modules based on the team member’s performance and goals with manager evaluations, action points, and one-on-one accountability prompts.
Low-tech solutions follow the same theory, with a more manual but no less rigorous analysis, synthesis, and action-oriented solution. Measurement strategy processes and tactics may take longer, but can serve up robust insight, action, and impact over defined, reasonable performance measurement stages. Manual, structured, but customized data-gathering conversations and action plans work toward precise outcomes at defined benchmarks. At each point, learning teams turn data into insight, then insight into performance action for—yes, Mr. Kirkpatrick—even upper-level business application and impact.
TRAINING METRICS SUCCESS: DATA THINKS FORWARD
Organizations that are data-driven but data-poor, data-rich but data-insight/action-casual, strong in metrics but lacking in effective analysis mechanisms (low- or high-tech), or variations of the above can increase their speed to success from a measurement plan dissection and/or (re)creation. Even organizations that have not yet articulated the employee behaviors that lead to needed metrics can achieve success with these steps toward the measurable training efficacy:
- Plan for a measurement strategy (the what, the how, the who, the why, the when).
- Dissect business metrics into performance behaviors.
- Use manual or automated tools that link business metrics to live employee performance expectations/levels.
- Use manual or automated push strategies to recommend a just-right, performance-based Learning Pathway for each learner.
- Ensure the Learning Pathway has built-in manual/automated manager support functions.
Follow this trajectory with either high- or low-tech learning analytics strategies and tools, and you can find yourself standing on Levels 3 and 4, reaching out to shake Mr. Kirkpatrick’s hand.