Remove Analysis Remove Comparison Remove Metrics Remove Score
article thumbnail

Measuring eLearning Success: Essential Metrics & Strategies

Hurix Digital

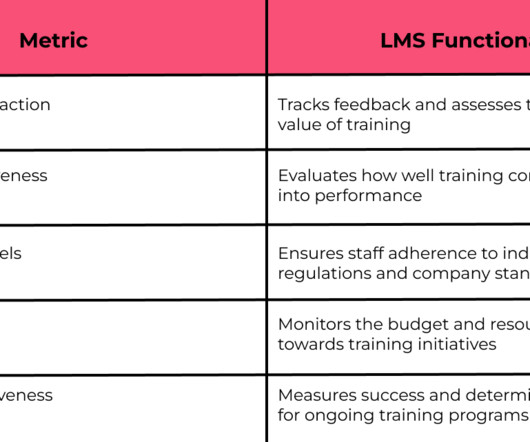
Evaluating the effectiveness of these initiatives necessitates a holistic approach, integrating diverse metrics and assessment strategies. Identify Enhancements: Analysis of metrics helps pinpoint areas requiring enhancement, be it in content relevance, user experience, or engagement strategies.

Metrics 40
article thumbnail

LMS Reporting: 7 Reasons LMS Reports Are Crucial For Online Corporate Training

The Be-all and End-all Guide to Creating a Supreme LearnDash LMS

You need to be aware of which training report needs to be pulled and shared directly for analysis from the LMS at any time. Because if the employees don’t complete training then there’s no point in looking at other metrics. After course completion rates, learner engagement is one of the key metrics in eLearning. lorman.com ).

Report 98
Insiders

Sign Up for our Newsletter

This site is protected by reCAPTCHA and the Google Privacy Policy and Terms of Service apply.

article thumbnail

How to Measure & Improve the ROI of Your LMS Investment

Appsembler

This article delves into effective strategies and metrics for assessing and enhancing the value derived from your LMS, focusing on Open edX as a prime example. Identifying key metrics such as user engagement and learning outcomes for measuring LMS success. User Engagement Metrics Engagement stands at the forefront of a successful LMS.

ROI 52
article thumbnail

Top 10 Tips for Successfully Training Employees Across Departments with an LMS

Academy of Mine

Factors to Consider when Selecting an LMS To ensure you choose an LMS that best fits your organizational needs, consider the following factors: Conduct a training needs analysis : Assess the learning needs of your employees across departments to establish the specific features your LMS will need to have.

LMS 52
article thumbnail

How Learning Pool overhauled its approach to User Experience Design

Learning Pool

In UX, this is a little more complicated than you’d expect because there aren’t any standard ways to measure the User Experience that wasn’t tied to metrics in other departments around the business. As our LEAFS scores increased so did the customer approval of the designs presented to them. Competitive Analysis. 5+7+4+6+6=28.

Design 98
article thumbnail

Degreed vs EdCast TXP vs Fuse – Battle 2.0

eLearning 24-7

The data that will be presented, the features, the comparison analysis – is relatively fresh. This comparison is system to system to system, based on capabilities, functionalities, system pros/cons (when applicable) – learner and administrator side, metrics too. Some Ground Rules. The latest viewing?

Metrics 88
article thumbnail

Get Your Red Hot Skills Functionality

eLearning 24-7

Yes, skill gap analysis existed, from 1999 in fact, after all that was the main premise for an LMS, to identify skill gaps, but the metrics specifically around skill gaps tied to other variables in the system, in a data visualization standpoint that doesn’t look like a bar chart? That my friends is metrics tied to skills.

Skills 105